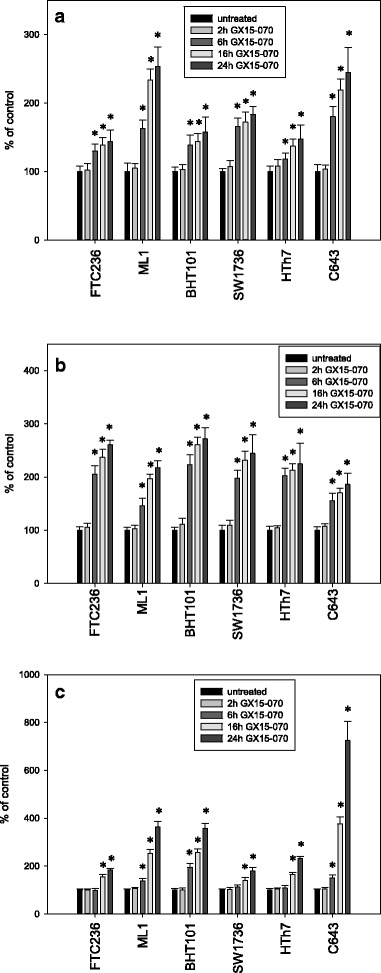
Fig. 4.

Increased activity of caspase 3 and 7 (a), increase in the concentration of cleaved caspase 3 fragments as a sign of progressing caspase activity (b) and increased LDH-release into the cell culture medium (c) after treatment with 0.1 μM GX15-070 for 2, 6, 16 and 24 h in different thyroid carcinoma cell lines. Values were determined by Apo-One assay, an ELISA specific for caspase 3 fragments and CytoTox-assay and are depicted as percent of vehicle-treated control. Data represent mean values of eight-fold determinations ± standard deviation; * indicates significant increase (p < 0.05, Student’s t-test)
