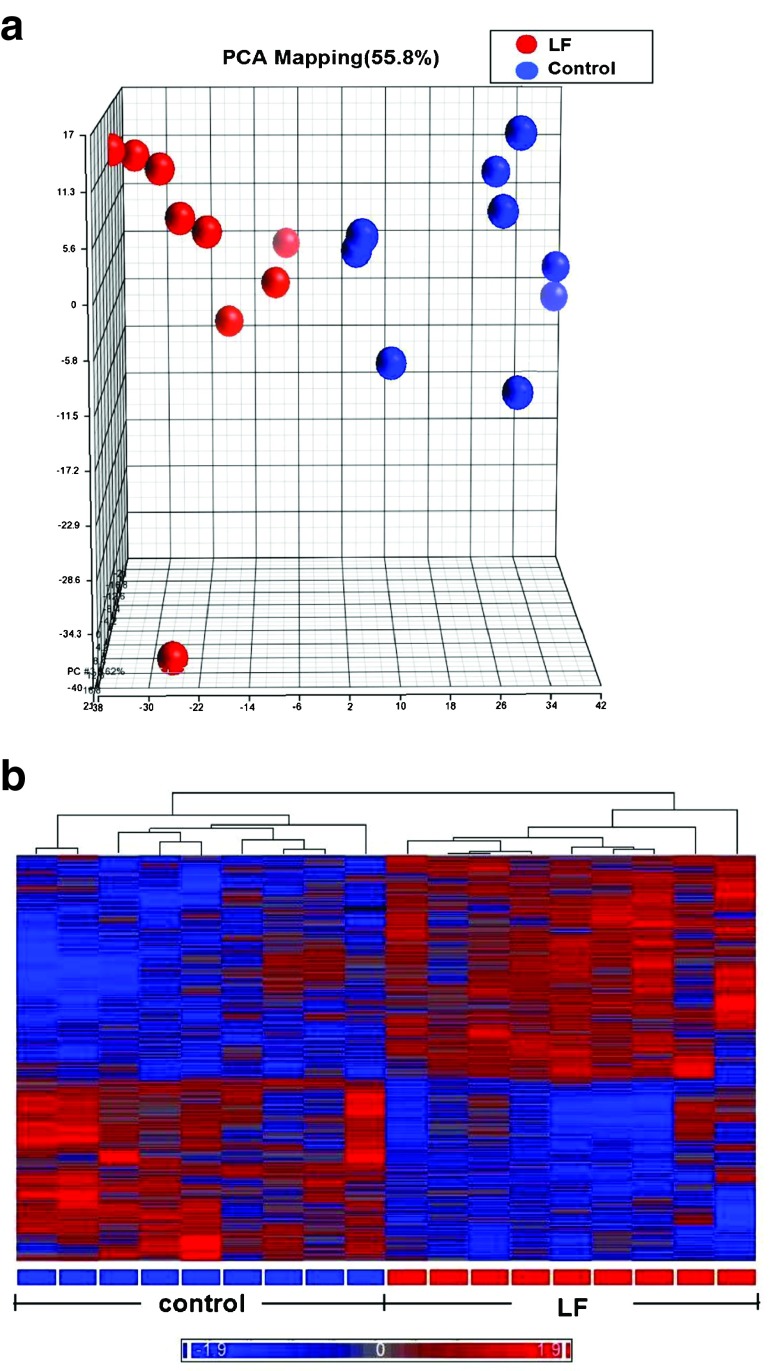
Fig. 1.
Gene profiling microarray analysis of hippocampal tissues from postnatal piglets after Lf intervention: a “principal component analysis” (PCA) mapping between Lf treatment (red, n = 9) and control group (blue, n = 9) using Partek Genomics Suite 6.5 software (www.partek.com). Each symbol represents a single sample. b A heat map representative of the 1,187 genes that were differentially expressed between the control and Lf groups (filter criteria: fold change 1.1 and p < 0.05). Blue: genes that were downregulated, red: genes that were upregulated. The normalized expression value is indicated at the bottom of the figure

