Fig. 4.
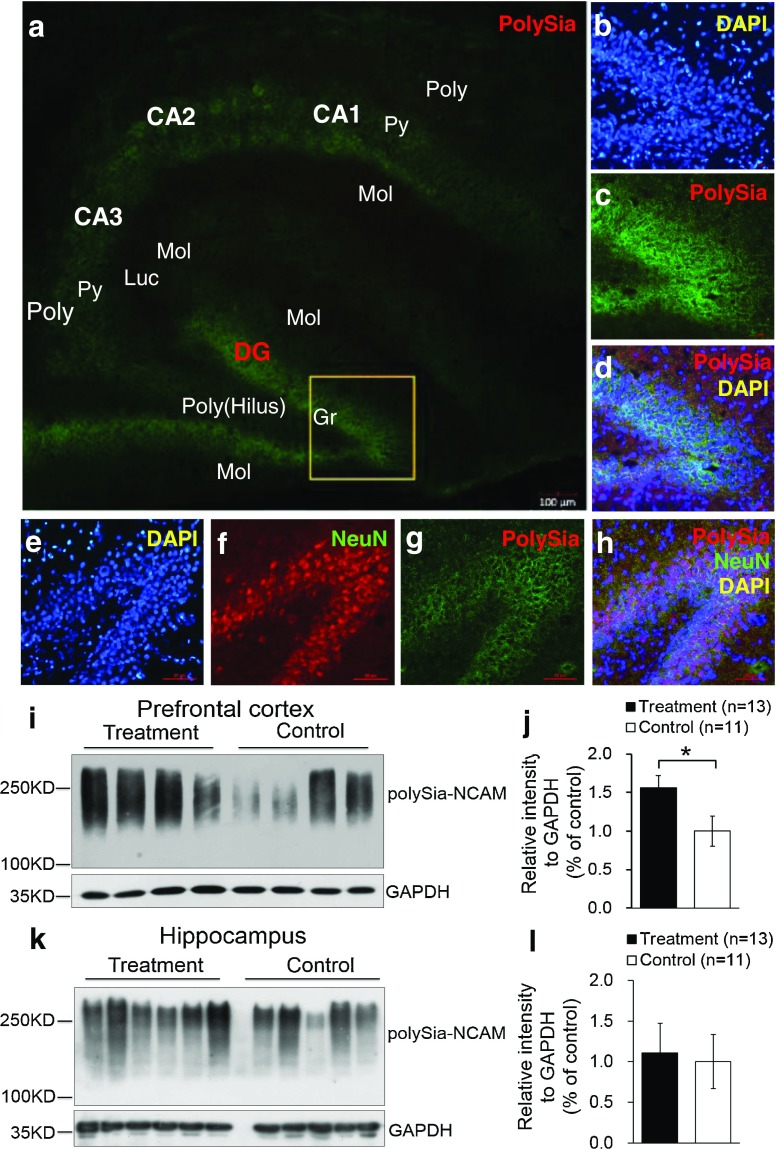
Lf upregulated polySia-NCAM expression in selected regions of the brain in postnatal piglets: a–d immunofluorescent staining of polySia-NCAM in the hippocampus (green, polySia-NCAM; blue, DAPI (a). Magnification (×4) images of polySia-NCAM staining in the hippocampus; DG dentate gyrus; CA1, CA2, and CA3: Cornu ammonis 1, 2, and 3; Poly stratum (S) polymorphum; Py S. pyramidale; Mol S. moleculare; luc S. lucidum as one part of the Mol in CA3; Gr granular cell layer and the S polymorphum in DG, also called the hilus of DG. b–d Higher magnification (×20) image of DAPI (b), polySia-NCAM (c) and d the merged images of b and c. e–h Immunofluorescent staining of the dentate gyrus in the hippocampus with DAPI (blue, e); NeuN (red, f); polySia-NCAM (green, g); and the merged images of polySia-NCAM, NeuN, and DAPI (h). Lf intervention increased the level of polySia-NCAM expression in the hippocampus and prefrontal cortex of postnatal piglets as confirmed by Western blot analyses. GAPDH served as the control for protein loading. i Levels of polySia-NCAM in the prefrontal cortex of four Lf-treated piglets vs. the control group (*p < 0.05, Student’s t test). j Quantitation of the Western blot analysis of the Lf-treated piglets (n = 15) vs. the control group (n = 11); k Western blot analyses of polySia-NCAM expression in the hippocampus of the Lf-treated piglets vs. the control group (p > 0.05, Student’s t test); and l quantitation of the Western blot analysis of the Lf-treated piglets (n = 13) vs. the control group (n = 11; (p > 0.05)

