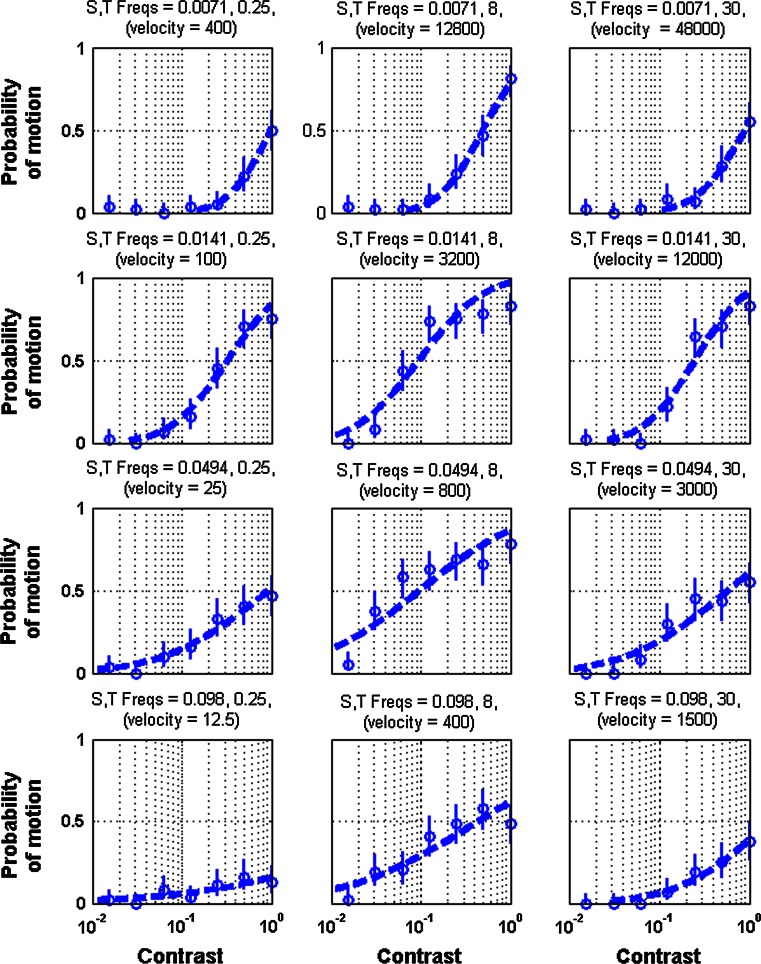
Fig. 2.
Psychometric functions of the mantis’ optomotor response to gratings of different contrast ratios and varying temporal and spatial frequencies. The spatial (cycles/deg) and temporal frequencies (Hz) are indicated above each plot along with the corresponding velocity (°/s). Circles indicate mean (±95 % confidence intervals) number of responses and the dashed lines indicate the fitted curves. Contrast thresholds were defined as the contrast ratio that elicited a 50 % probability of response. Data are pooled across individuals

