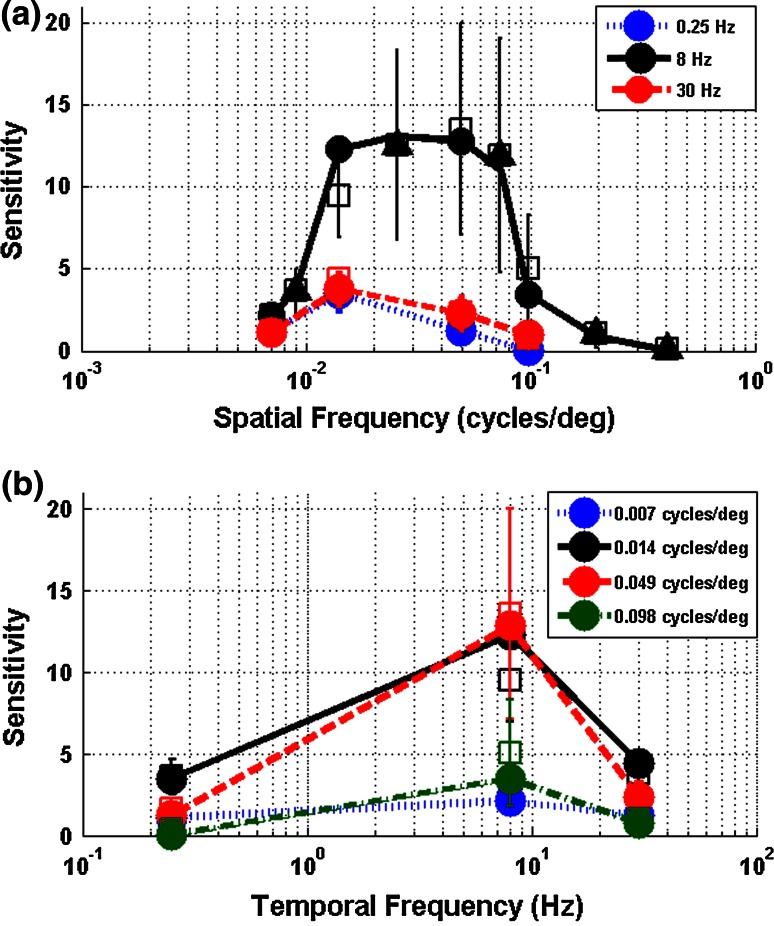
Fig. 3.
Sensitivity of the mantis’ optomotor response. Mean sensitivity at (a) different temporal frequencies across varying spatial frequencies and (b) different spatial frequencies across varying temporal frequencies. Triangles in the upper plot represent data points corrected for observer bias (see main text for further details). Circles represent data pooled across all individuals. Squares represent means of individual sensitivities and error bars represent standard error around these means

