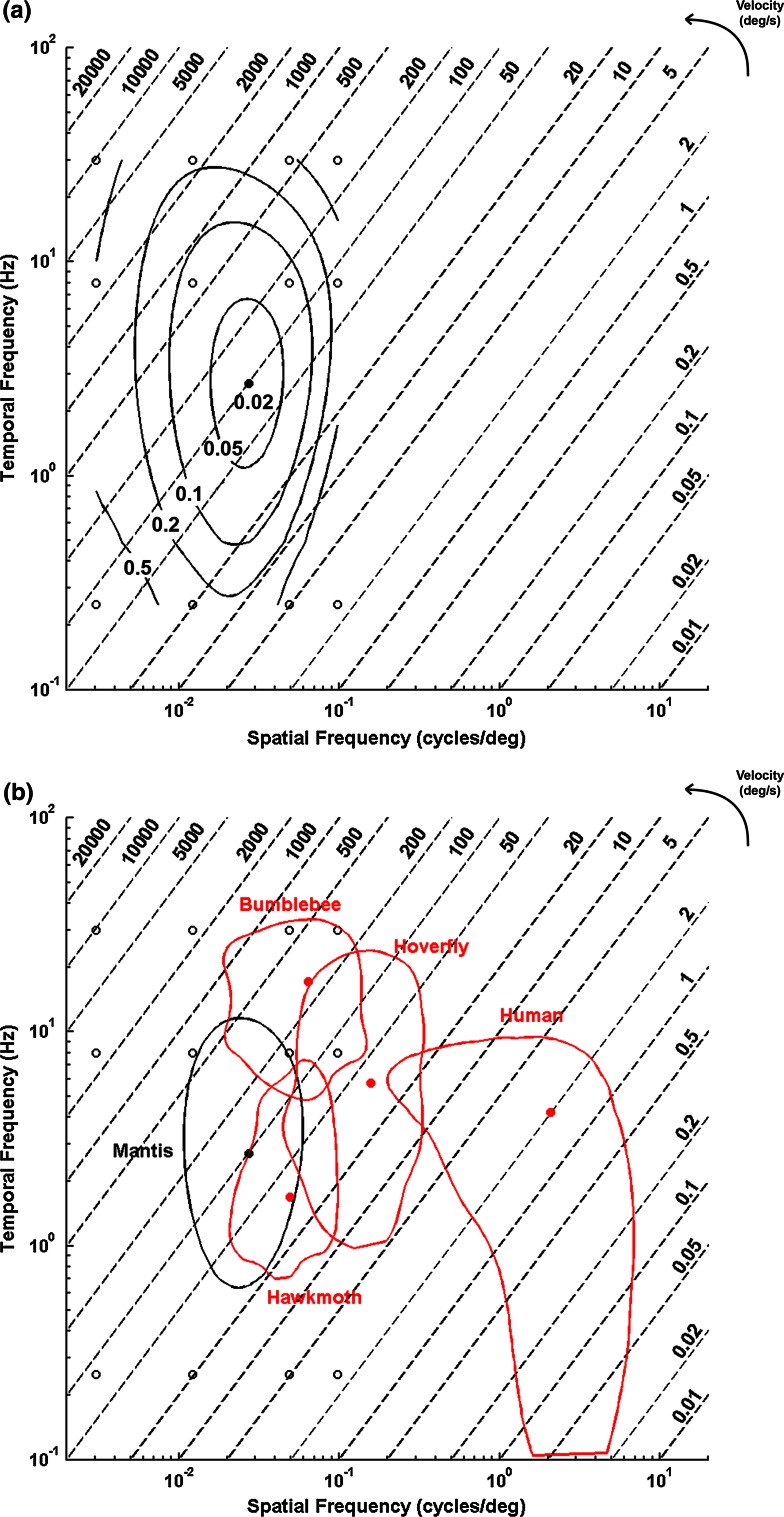
Fig. 4.
Contour plots of contrast thresholds. Contour lines represent (a) isolines of mantis contrast thresholds across different spatial and temporal frequencies and (b) the locus where contrast sensitivity falls to half maximum in the mantis (black line and dot) compared to other species [red lines and dots; data after (O’Carroll et al. 1996)]: hawkmoths (Deilephila), hoverflies (Volucella), bumblebees (Bombus) and humans. Linear interpolation done by Matlab interp2 function. Diagonal dashed lines indicate velocities. Filled central dots represent regions of maximum sensitivity in all species. Open circles represent the data used to interpolate the contour for the mantis. Interpolation indicates our mantises display their optimal sensitivity at a spatial frequency of around 0.03 cycles/deg and a temporal frequency of 2.7 Hz. At this point, their contrast threshold is around 0.038

