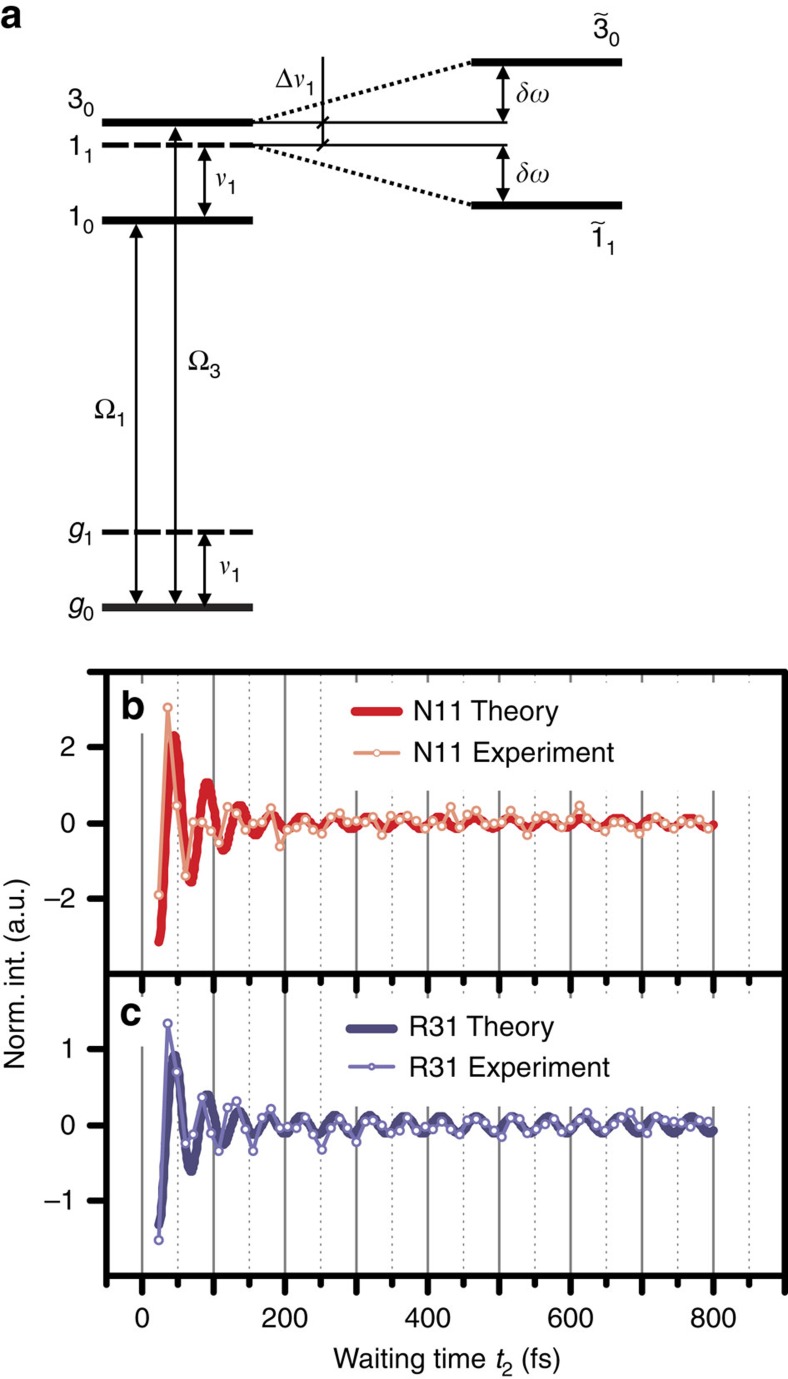
Figure 3. Vibronic model.
(a) We consider a vibronic model for bands 1 and 3 coupled to a vibrational mode with frequency ν1≈668 cm−1 (see Supplementary Note 2). The vibronic states |k0〉 and |k1〉 denote the vibrational ground and first excited states of an electronic state |k〉, respectively, with the single index states |g〉, |1〉 and |3〉 denoting the electronic ground state and bands 1 and 3, respectively. The exciton energy splitting ΔΩ31=Ω3−Ω1 between bands 1 and 3 is quasi-resonant with the vibrational frequency ν1, where the detuning is denoted by Δν1=ΔΩ31−ν1. The exciton–vibrational coupling between uncoupled states |30〉 and |11〉 leads to vibronic eigenstates  and
and  , each of which is a superposition of |30〉 and |11〉, leading to an energy-level shifting by δω. (b) The time trace of N11 in normalized intensity (Norm. Int.) against waiting time t2, where the experimental results are shown as light red circles and the theoretical simulation is shown as a full red line. (c) The time trace of R31 where the experimental results are shown as light blue circles and the simulated data are depicted as a full blue line. The root mean squared deviation between the experimental results and theoretical simulation in b and c is 0.92 and 0.59, respectively.

