
Figure 2. E2a regulates Samd2/3 positioning at lefty and represses lefty transcription.
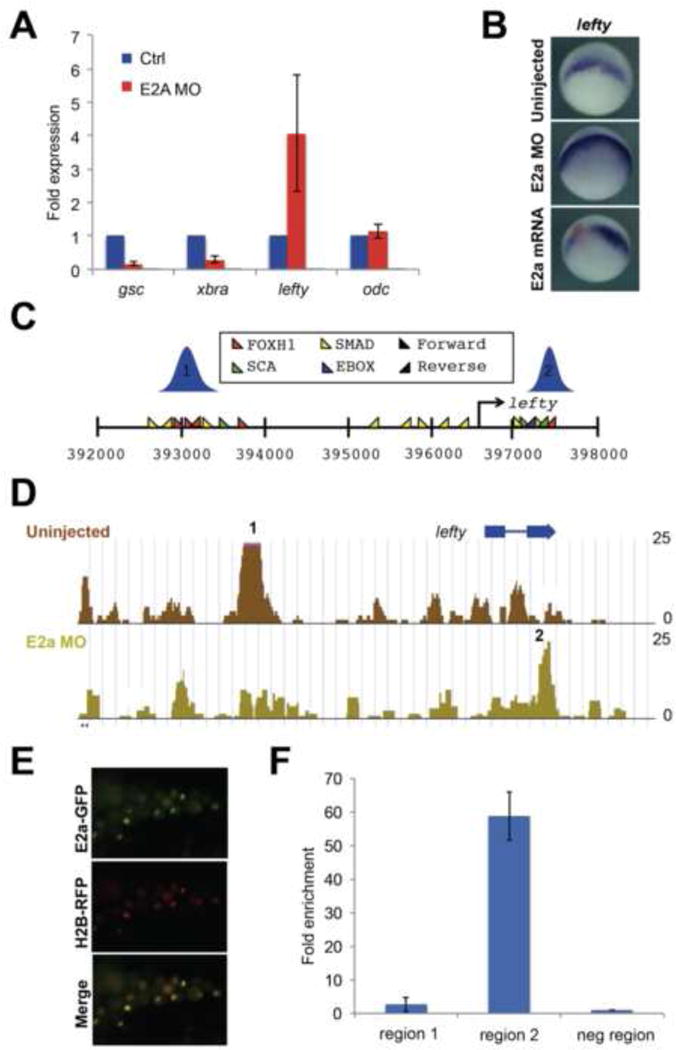
A) qRT-PCR showing upregulation of lefty in E2a depleted embryos, and downregulation of gsc and xbra. odc is shown as a loading control. Error bars represent standard deviations for three biological replicates. B) In situ hybridization for lefty expression at stage 10 in control, E2a depleted, and e2a mRNA injected embryos (red=lacZ lineage tracer). C) Distribution of key transcription factor binding sites near the lefty locus. There are two regions of observed Smad2/3 binding in control embryos, schematized in blue. D) In E2a-depleted embryos, Smad2/3 binding at region 1 is reduced, while binding at region 2 is increased. Fold enrichment over input is shown along the Y axis. E) Embryos were injected at the 2-cell stage with mE2a-GFP and RFP-tagged histone H2b mRNA and monitored for fluorescence at stage 10.5. F) ChIP-qRT-PCR using anti-GFP antibodies in stage 10.5 embryos following mE2a-GFP injection at the 2-cell stage. Y axis represents fold enrichment over a negative control region near the lefty locus. See also Figure S1.