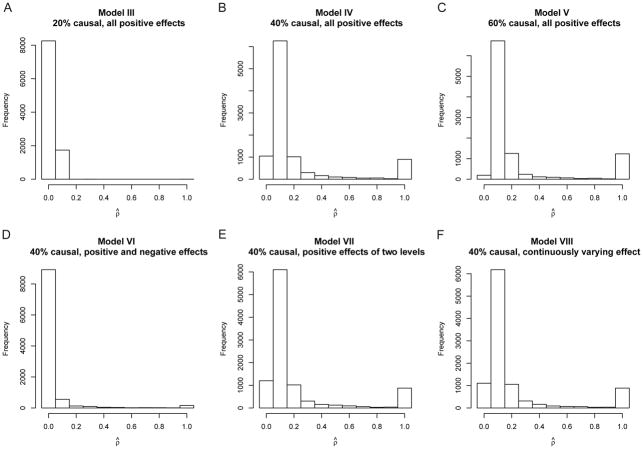
Figure 3.
Histograms of the optimal ρ selected by MONSTER for various simulation models. Panels A–F show the empirical distribution of the optimal ρ selected by MONSTER for Models III–VIII, respectively, where these models are given in Table 2. Each histogram is based on 10,000 replicates, and the optimal ρ is selected from {0, 0.1, …, 0.9, 1}.

