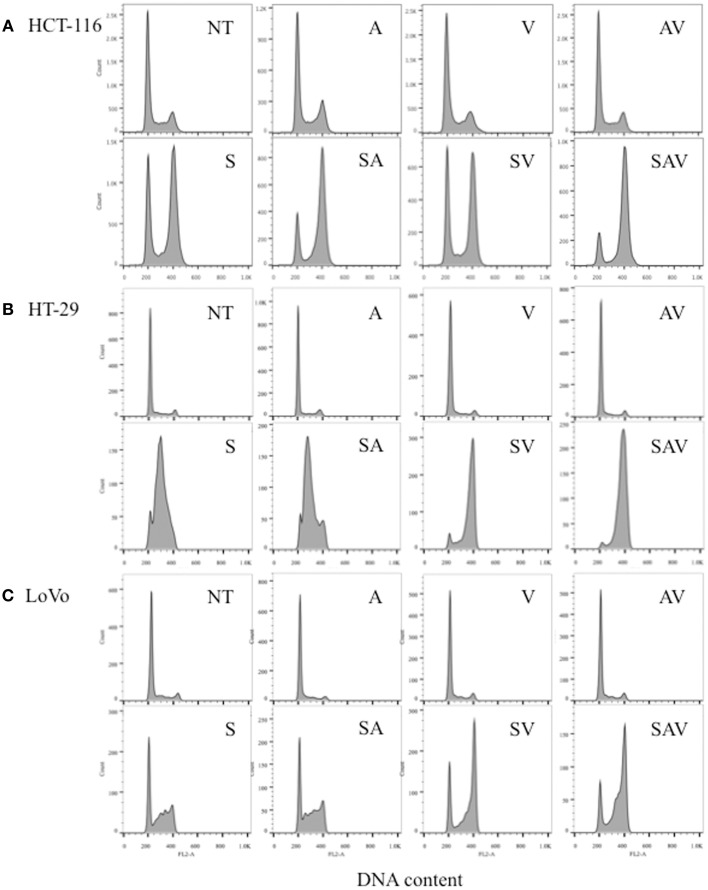
Figure 2.
Cell cycle analysis of (A) HCT-116, (B) HT-29, and (C) LoVo cell lines 24 h post treatment with IC50 concentrations of SN38 (S) and/or 0.5 μM ABT-888 (A) 1 μM VE-821 (V) or both (AV). (NT) cells treated with vehicle alone, (AV) ABT-888 and VE-821, (SA) SN38 and ABT-888, (SV) SN38 and VE-821, and (SAV) SN38, ABT-888 and VE-821 in combination.

