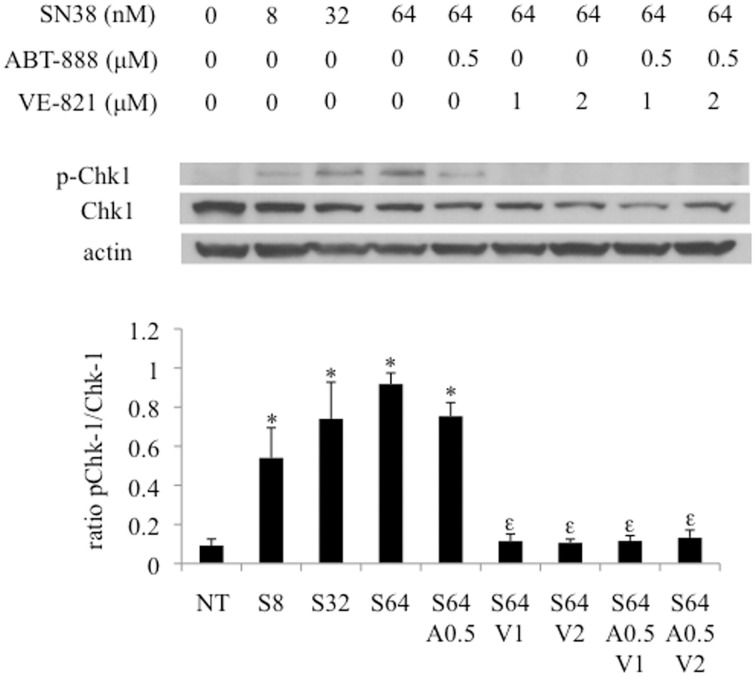
Figure 5.
Effect of combination drug treatments (24 h) on the expression and phosphorylation status of Chk-1 (S317) in HCT-116 cells as determined by western blot analysis, representative of 3 replicates. NT = vehicle treated control, S8 = 8 nM SN38, S32 = 32 nM SN38, S64 = 64 nM SN38, A0.5 = 0.5 μM ABT-888, V1 = 1 μM VE-821, and V2 = 2 μM VE-821. *Significantly different from NT cells, εsignificantly different from S64 cells, p ≤ 0.05.

