
Figure 1.
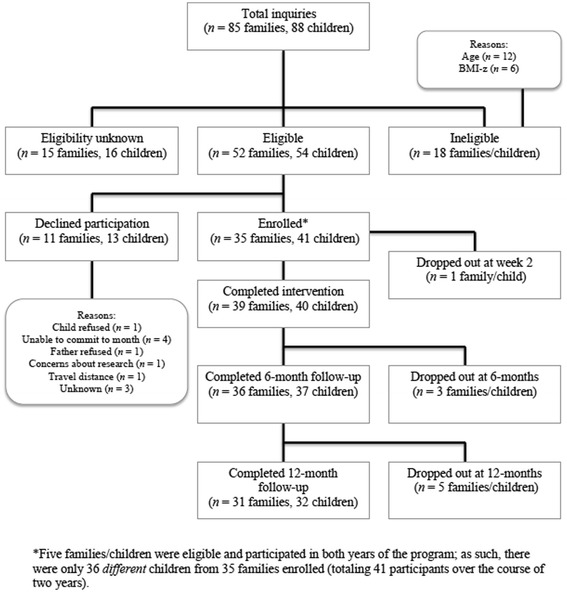
Combined (Years 1 and 2) participation and attrition rates of the Children’s Health and Activity Modification Program.
Official websites use .gov
A
.gov website belongs to an official
government organization in the United States.
Secure .gov websites use HTTPS
A lock (
) or https:// means you've safely
connected to the .gov website. Share sensitive
information only on official, secure websites.
Combined (Years 1 and 2) participation and attrition rates of the Children’s Health and Activity Modification Program.