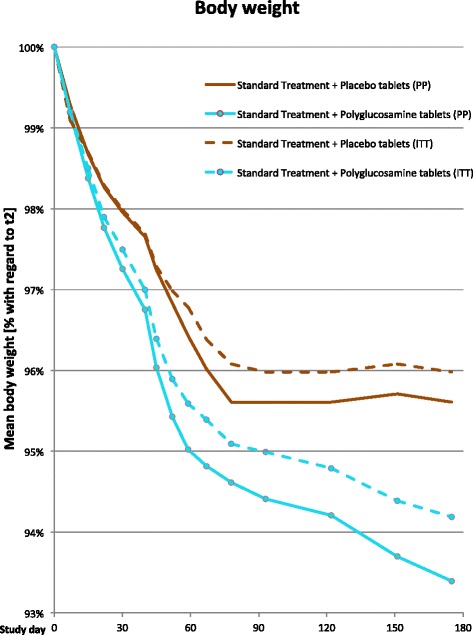
Fig. 2.

Mean body weight [% with regard to t2]. The red solid line shows the % reduction in body weight of the group (PP) receiving “standard-treatment plus placebo tablets” against weight loss and the cyan solid line in the group receiving “standard treatment plus polyglucosamine tablets” (PP), whereas the dashed lines in the respective colors denote the progress of the ITT groups
