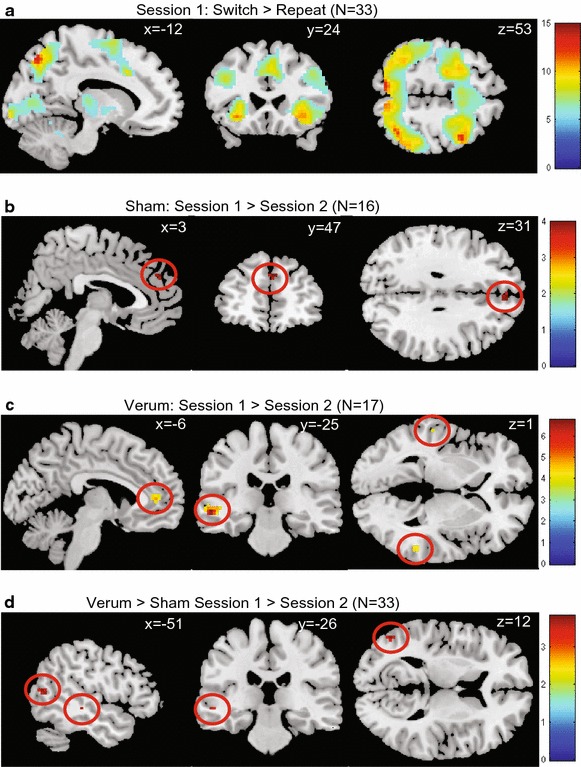
Figure 2.

Main effect of task on activity and interaction effects. T-statistic images for the switch > repeat contrast. Threshold at p = .05, whole-brain family-wise error-corrected, with an extent of k > 10 for the main effect (a), and p = .001 (uncorrected) with an extent-threshold of k > 5 for the interaction effects (b, c, d), overlain on ch2better MNI template with MRIcron. (http://www.mccauslandcenter.sc.edu/mricro/mricron). Coordinates are in MNI space. The colored bar indicates the Z values.
