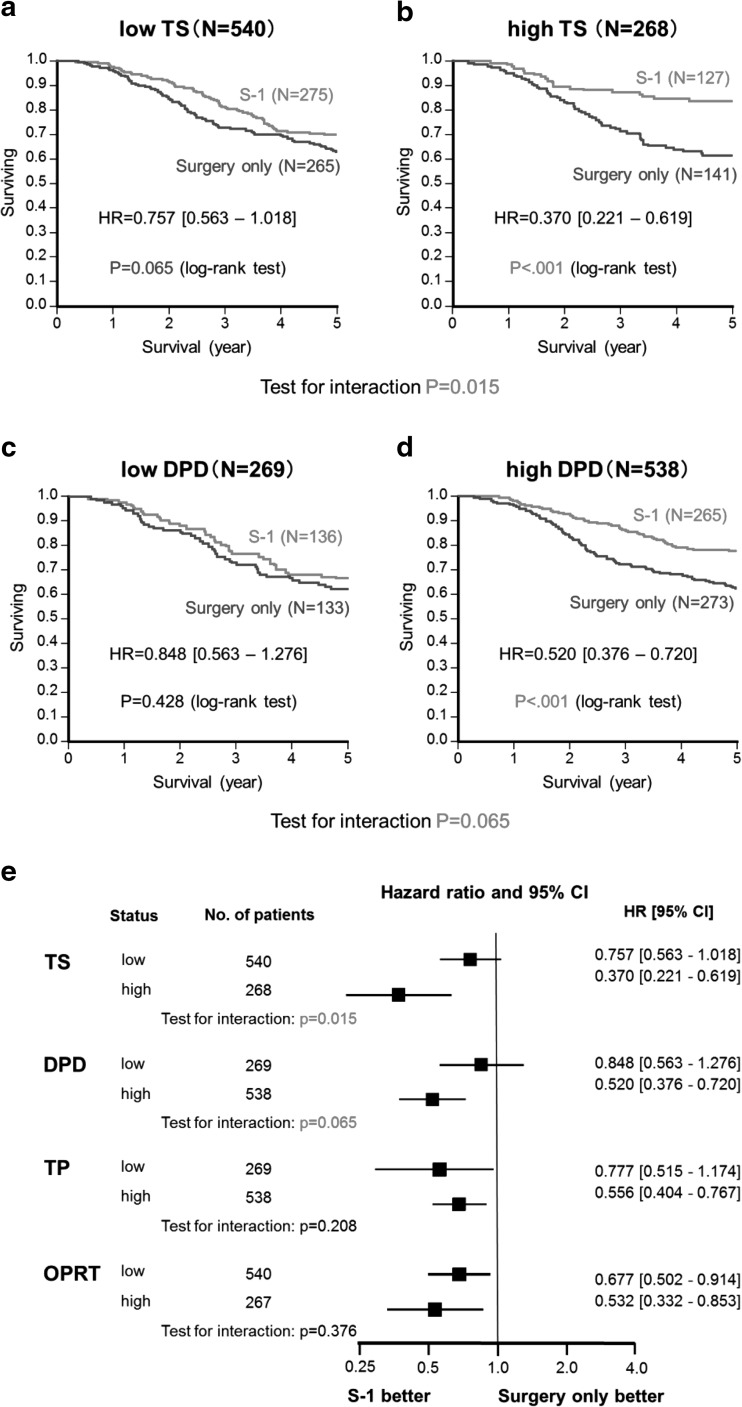
Fig. 2a–e.
Kaplan–Meier curves showing overall survival for patients in the S-1-treated (red) and surgery-only (blue) groups for tumors with a low TS expression (<66.7th percentile), b high TS expression(>66.7th percentile), c low DPD expression (<33.3rd percentile), d high DPD expression (>33.3rd percentile). e Subgroup analysis of hazard ratios and overall survival

