
FIGURE 4.
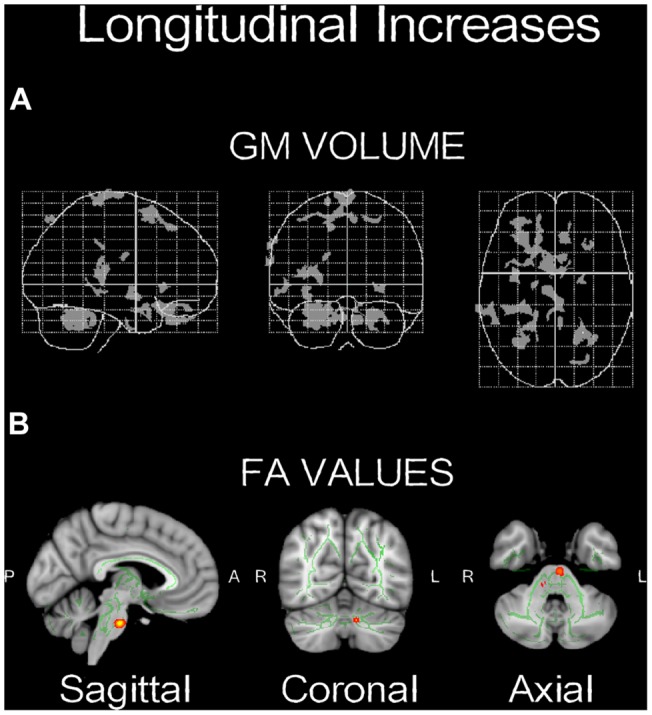
Neuroplasticity following longitudinal (4-weeks) daily QMT. (A) Significant increases in GM volume (p < 0.001, uncorrected) projected onto the glass brain; (B) Significant increases in FA values (p < 0.01, uncorrected) onto brain template. Red-yellow color scale is related to the p-values (in which yellow is highest).