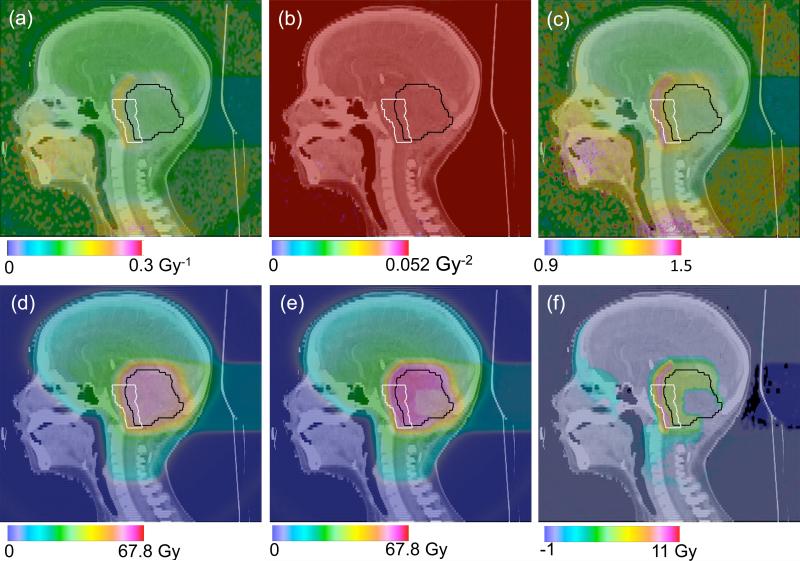
Figure 6.
Patient case simulation study of a pediatric head and neck proton treatment. The model by Wedenberg et al was used to score the values for α (a) and β (b) as well as the corresponding RBE value (c). The resulting biological dose with a constant RBE = 1.1 (d) is shown together with the biological dose when using the model (e). (f) shows the dose difference between (d) and (e).

