
Figure 3. Clustering diagrams of phosphosites with statistically significant differences in abundance.
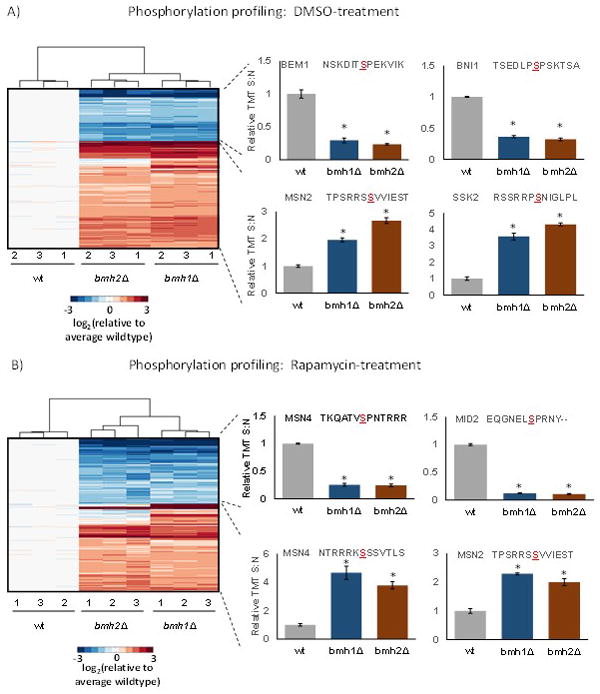
A) Phosphosites in the DMSO-treated control cultures with examples of those enriched in certain KEGG pathways. We highlighted two phosphorylation sites that were up-regulated with RRxS sites and down-regulated with SP sites. B) Phosphosites in the rapamycin-treated control cultures. We highlighted two phosphorylation sites that were up-regulated with RRxS sites and down-regulated with SP sites. The color scale of the heat map was capped at +/−3 and represented log2(mutant/wildtype). * indicates statistical significance as demonstrated by a Bonferroni-corrected p-value <0.01.