
Fig. 5.
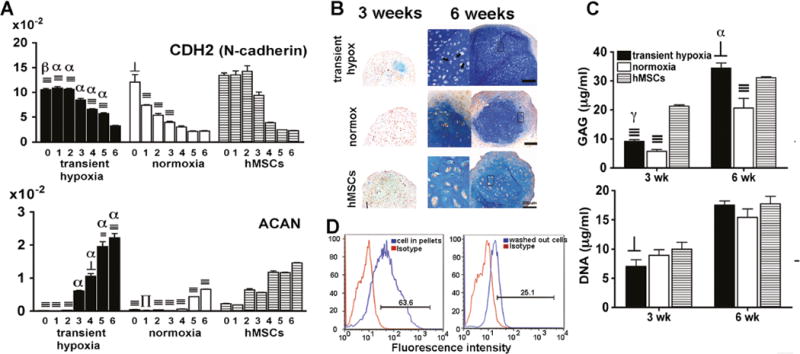
Cell condensation and proteoglycan production. a Pellets derived from transient hypoxia EBs (Group 4), normoxia EBs (Group 2) and hMSCs were analyzed for gene expression for N-cadherin and ACAN. Gene expression levels were normalized with ACTB. Data show average ± SD of four samples. ⊥, ∏, ≡ denote significant differences compared with hMSCs within the same time point, where p<0.05, 0.01 and 0.001, respectively. γ, β, α denote significant differences compared with normoxia, where p<0.05, 0.01 and 0.001, respectively. b Alcian blue staining at 3 and 6 weeks of chondrogenic pellets. Arrows indicate lacunae inside 40× inserts. c GAG and DNA contents at 3 and 6 weeks of chondrogenic pellets. Data show average±SD of four samples. ⊥ and≡denote significant differences compared with hMSCs within the same time point, where p<0.05 and 0.001, respectively. γ, β, α denote significant difference compared with normoxia, where p<0.05, 0.01 and 0.001, respectively. d Flow cytometric analysis of pellets derived from transient hypoxia EBs (Group 4). Cells of chondrogenic pellets and washed out cells at week 1 were stained with N-cadherin antibody. Percentages of N-cadherin positive cells with respect to isotype control are indicated in each figure