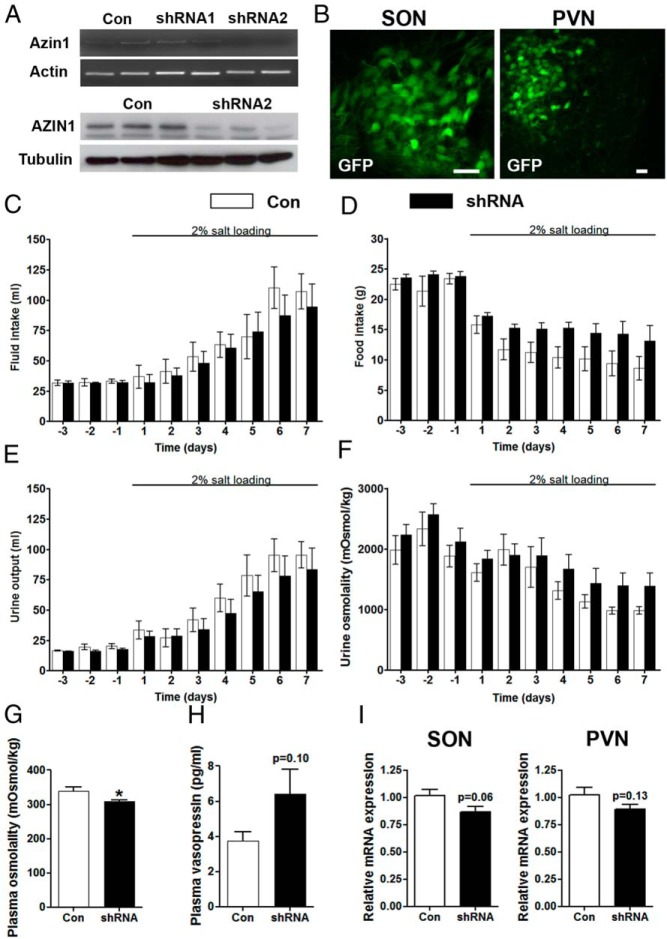
Figure 5.
Metabolic analysis of gene function. A, RT-PCR and Western blotting validation of lentiviral-mediated knockdown of Azin1 by shRNAs in rat PC12 cells. β-Actin was used as the internal control for RT-PCR and GAPDH for Western blotting. B, Lentiviral transduction of magnocellular neurons in the SON and PVN. Rats were bilaterally injected into SON and PVN with lentiviral vectors expressing Azin1 shRNA2, or control shRNA. Two weeks after the injection, the rats were placed in metabolic cages for 10 days during which water intake (C), food intake (D), urine output (E), and urine osmolality (F) were recorded. On day 3 rats were presented with 2% (wt/vol) NaCl solution in place of drinking water for 7 days. Urine (F) and plasma (G) osmolality were measured by freezing point depression, and plasma AVP levels were determined by ELISA (H). I, Relative expression of Azin1 in SON and PVN of Azin1 shRNA-delivered animals compared with control shRNA. Values are means ± SEM of n = 6 animals per group. *, P < .05. Scale bars, 60 μm. Con, control.

