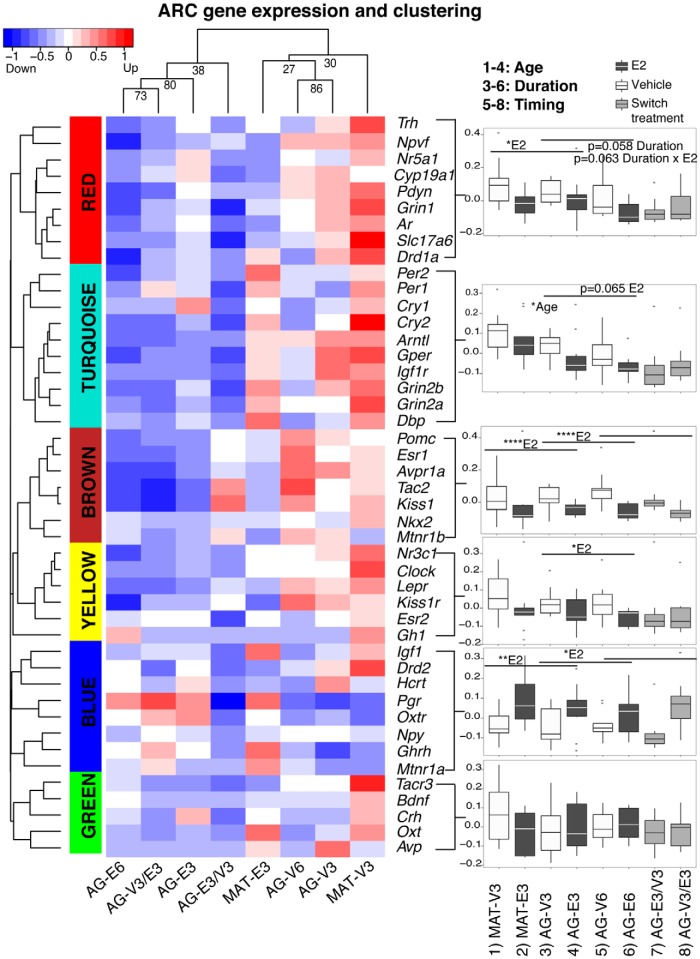
Figure 2.
Modules of highly correlated genes in the ARC of the hypothalamus were identified by gene expression and clustering analysis. The hierarchical clustering dendrogram of 45 genes was cut to yield 6 color-coded modules. The gene expression heat map with blue-red representation was illustrated for each treatment group. Using a representative eigengene value, each module was plotted and analyzed to detect age, duration, and timing of hormone effects, and summarized in Supplemental Table 3. Significant P values are shown as *, P < .05; **, P < .01; ****, P < .0001. Trends (0.05 < P < .1) are also reported on the graphs. Treatment group correlations are shown on top of the heat map. Note that the ordering of groups on the heat map was determined by similarity of modules so the group orders are different from those shown in the box-and-whisker plots.

