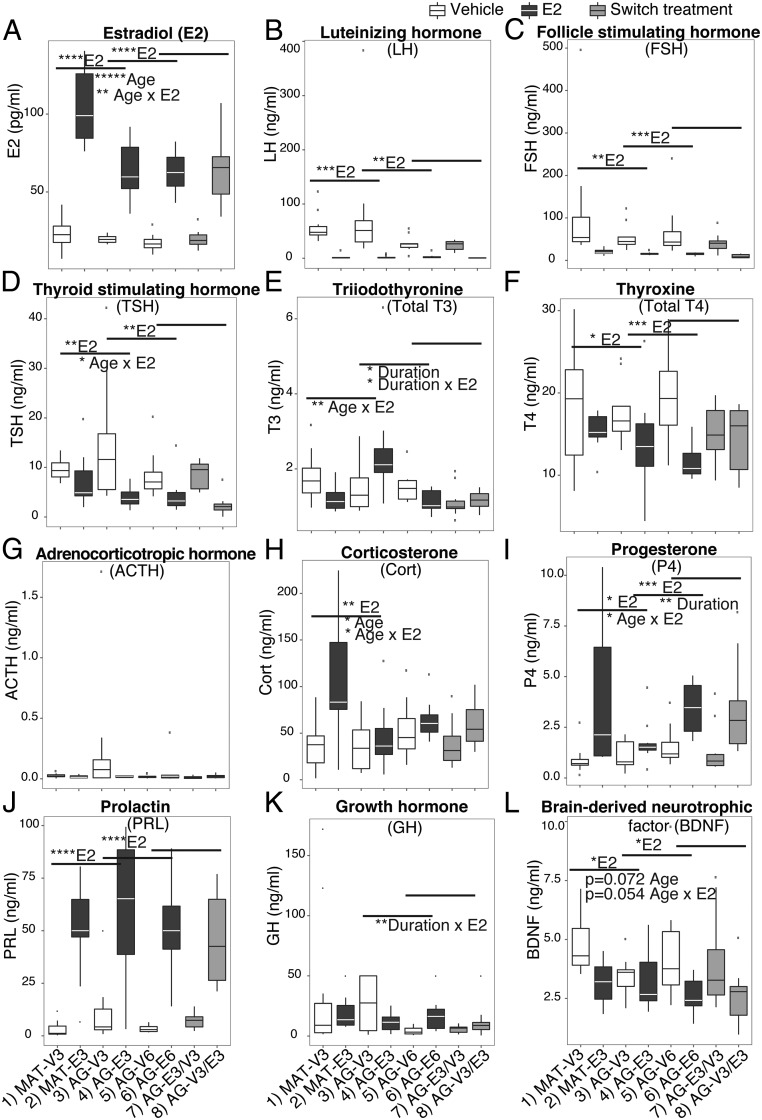
Figure 4.
Serum concentrations of 12 hormones were differentially affected by age, and timing and duration of E2 treatment. Panels are organized for hormones involved in HPG axis (A–C), HPT axis (D–F), HPA axis (G–I), and growth and neurotropic factors (J–L). E2 treatment significantly elevated serum E2 (A), P4 (I), and PRL (J) and lowered LH (B), FSH (C), TSH (D), and T4 (F). An age effect was shown for serum E2 (A), Cort (H), and BDNF (L). Age × E2 interaction effects were found for serum E2 (A), TSH (D), T3 (E), Cort (H), P4 (I), and BDNF (L). A longer duration of E2 treatment significantly lowered T3 (E) and elevated P4 (I). Significant P values are shown as *, P < .05; **, P < .01; ***, P < .001; ****, P < .0001. Trends (0.05 < P < .1) are also reported on the graph. n = 10 per group.

