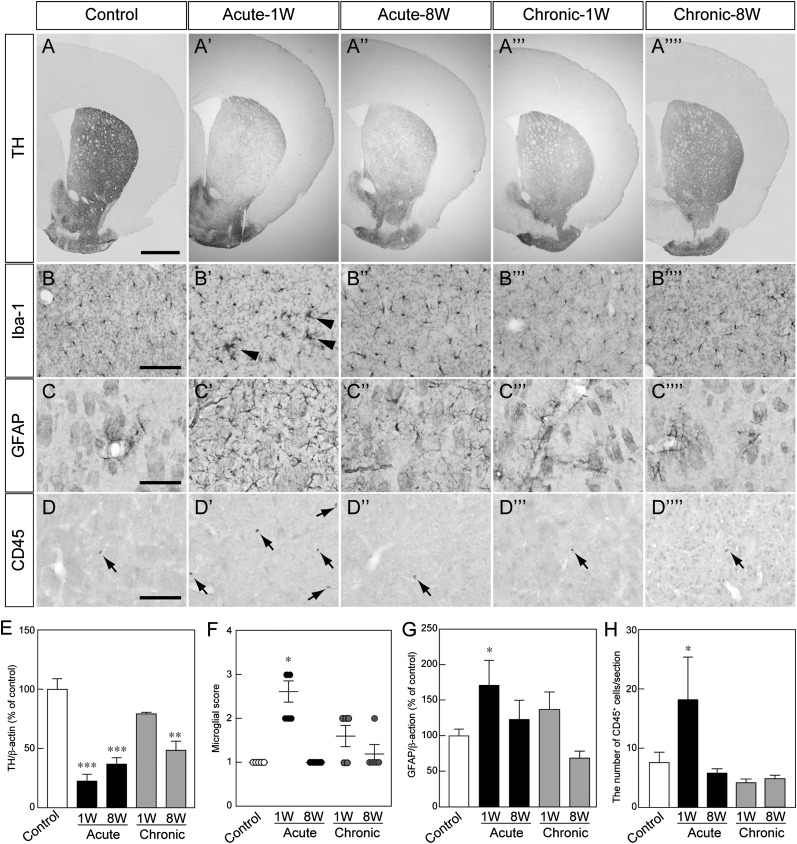
Figure 2.
Histological analysis of the striatum in each MPTP-treated mouse. (A–D): Representative photomicrographs of striatal TH-positive (TH+) fibers (A), Iba1+ cells (arrowheads indicate the accumulation of Iba1+ cells) (B), GFAP+ cells (C), and CD45+ cells (arrows) (D). Scale bars = 500 μm (A) and 100 μm (B–D). (E–H): Quantitative analysis of the protein level of TH (E), microglial activation (F), the protein level of GFAP (G), and the number of CD45+ cells (H). Each value is given as the mean ± SEM (n = 3–5). ∗, p < .05; ∗∗, p < .01; ∗∗∗, p < .001 versus control group. Abbreviations: 1W, 1 week after administration; 8W, 8 weeks after administration; MPTP, 1-methyl-4-phenyl-1,2,3,6-tetrahydropyridine.

