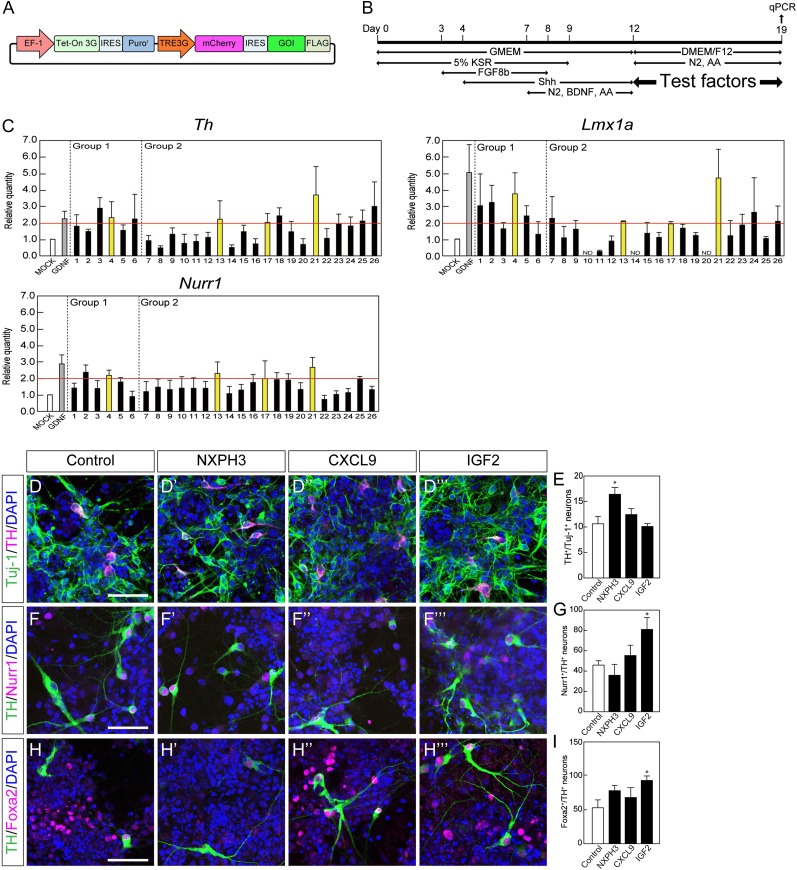
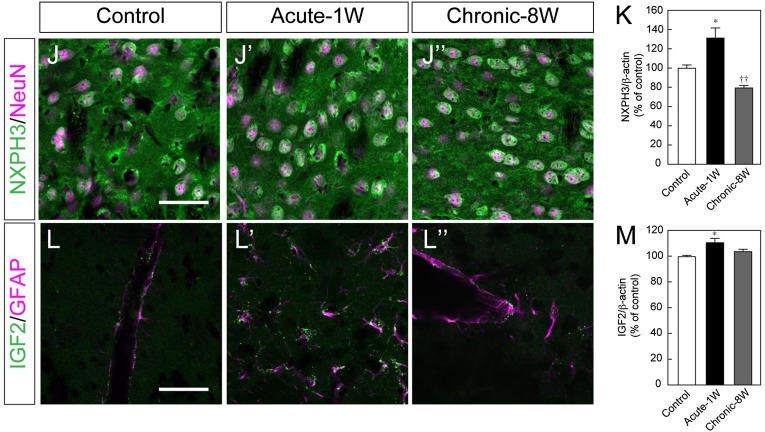
Figure 4.
Functional screening of candidate genes by in vitro assay. (A): Schematic drawing of the construct of the Tet-on-inducible mCherry and 3xFLAG-tagged gene-of-interest (GOI) expression vector. (B): Experimental procedure for the functional screening. Day 12 induced pluripotent stem cell-derived aggregates were cocultured with GOI-secreting HEK293T cells for 7 days (described in Materials and Methods). (C): The effect of each factor was evaluated by a qPCR-based assay. Each gene number corresponds to Table 1. Each value is given as the mean ± SEM (n = 3–7). (D, F, H): Double-labeled immunofluorescence images for Tuj-1 (green) and TH (magenta) (D), TH (green) and Nurr1 (magenta) (F), TH (green) and Foxa2 (magenta) (H) with or without each soluble factor. Scale bar = 50 μm. (E, G, I): The ratio of TH+ neurons per Tuj-1+ neuron (E), Nurr1+ neurons per TH+ neuron (G) and Foxa2+ neurons per TH+ neurons (I). Each value is given as the mean ± SEM (n = 3). ∗, p < .05 versus control group. (J, L): Double-labeled immunofluorescence images of the striatum of MPTP-treated mice for NXPH3 (green) and NeuN (magenta) (J) and for IGF2 (green) and GFAP (magenta) (L). Scale bar = 50 μm (K, M): Semiquantitative analysis of the protein level of NXPH3 (K) and IGF2 (M) in the striatum. Each value is given as the mean ± SEM (n = 3). ∗, p < .05 versus control group; ††, p < .01 versus acute-1W group. Abbreviations: acute-1W, 1 week after acute administration; AA, ascorbic acid; BDNF, brain-derived neurotrophic factor; chronic-8W, 8 weeks after chronic administration; DAPI, 4′,6-diamidino-2-phenylindole; DMEM/F12; Dulbecco’s modified Eagle’s medium nutrient mixture F12; GDNF, glial cell-derived neurotrophic factor; GMEM, Glasgow minimum essential medium; KSR, knockout serum replacement; MPTP, 1-methyl-4-phenyl-1,2,3,6-tetrahydropyridine; N2, N2-supplement; qPCR, quantitative polymerase chain reaction.


