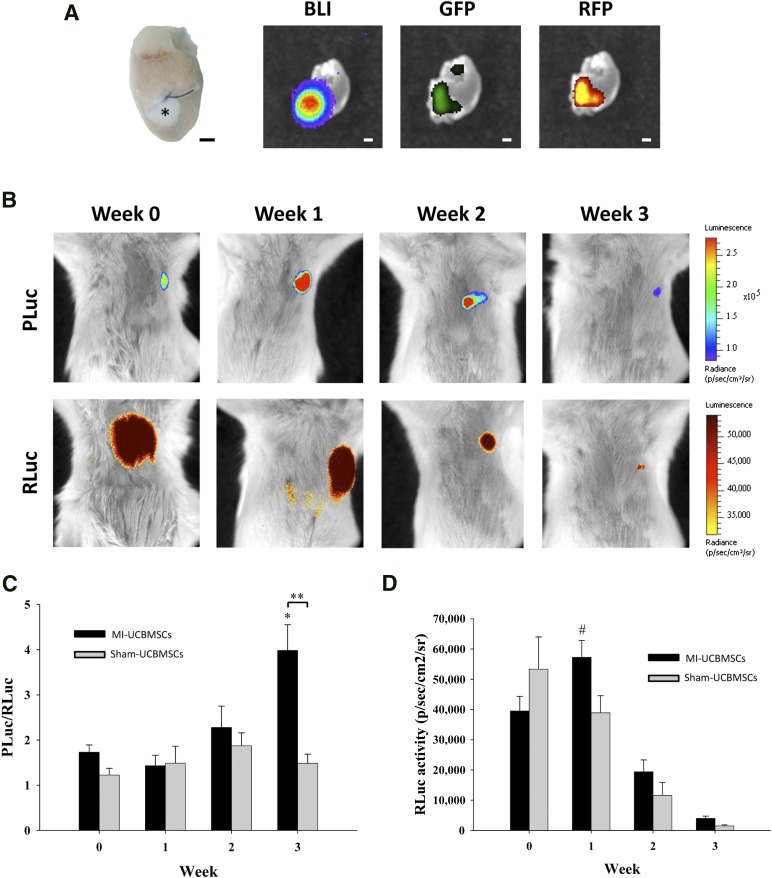
Figure 3.
BLI of the three-dimensional engineered fibrin-cell patches implanted over infarcted myocardium wounds. (A): Representative photographs of a heart excised from a postinfarct mouse at 4 weeks after implantation of an adhesive fibrin-based patch composed of human UCBMSCs (asterisk) showing PLuc bioluminescence and eGFP and mRFP1 fluorescence emission. (B): BLI of PLuc (top) or RLuc (bottom) from the implanted UCBMSCs. Bioluminescence images are superimposed on black and white images of recipient mice. The color bars illustrate the relative light intensities from PLuc and RLuc (low, blue and yellow; high, red and black). Histograms show changes in the PLuc/RLuc ratio (C) and total RLuc activity (D). ∗, p = .003 and #, p = .045 (relative to time of implantation), and ∗∗, p < .001. Scale bars = 1 mm. Abbreviations: BLI, bioluminescence imaging; eGFP, enhanced green fluorescent protein; PLuc, Photinus pyralis luciferase; RLuc, Renilla reniformis luciferase; p/s/cm2/sr, photons per second per square centimeter per steradian; UCBMSCs, umbilical cord blood mesenchymal stem cells.

