Figure 3.
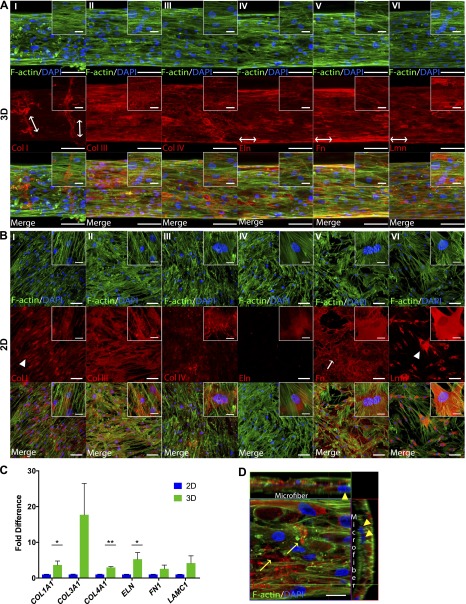
Deposition of Col I, III, and IV, Eln, Fn, and Lmn by SMCs in 3D vs. 2D. Confocal Z-stack image reconstructions are shown of ECM in (A) 3D fibrin fibers and (B) 2D fibrin-coated surfaces. Red indicates corresponding ECM, blue shows nuclei, and green indicates F-actin. Arrows and arrowheads point to randomly deposited and nonpolymerized ECM proteins, respectively. Double-headed arrows show alignment direction of organized ECM deposition. Scale bars, 100 μm. Inset scale bars, 25 μm. C) RT-PCR analysis of expression of ECM genes by pericytes cultured on 2D vs. 3D. Error bars represent SEM (n ≥ 2). Significance levels in the distribution are represented by *P < 0.05 and **P < 0.01. D) Orthogonal view of pericytes grown on microfibers. Arrowheads point to cells underneath the outer cell layer; arrows point to extracellularly deposited Lmn. Scale bar, 20 μm.

