
Figure 3.
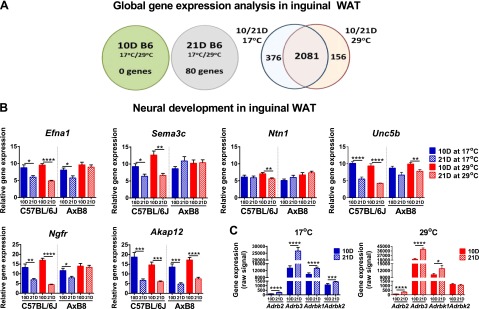
Global gene expression analysis in ING. A) Diagrams showing the results of microarray analyses of 10 and 21D B6 (C57BL/6J) mice, presenting the number of differentially expressed genes with an FC (abs) > 1.5. B) Expression of genes of neural development in the developing B6 and AxB8 mice. C) Expression of β3-adrenergic signaling genes determined by microarray analyses in 10 and 21D B6 mice. Data are expressed as means ± sem. *P < 0.05; **P < 0.01; ***P < 0.001; ****P < 0.0001. See Supplemental Table S2.