Figure 1.
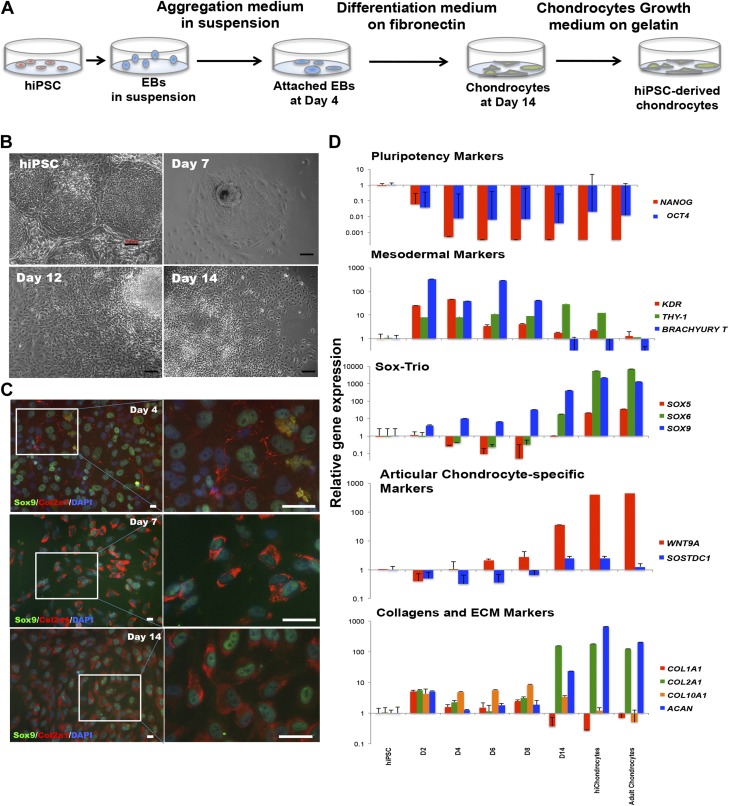
Efficient differentiation of hiPSCs into stable chondrocytes. A) Chondrogenic differentiation of hiPSCs. B) Representative morphologic changes in hiPSCs during chondrogenic differentiation at different stages (undifferentiated hiPSCs, d 7, 12, and 14 after differentiation). Scale bar, 100 μm. C) Representative immunofluorescence staining of chondrocyte markers, Sox9 and Col2a1 during hiPSC differentiation at d 4, 7, and 14. Scale bar, 100 μm. D) Gene expression analyses using quantitative real-time PCR for pluripotency markers (OCT4 and NANOG), mesodermal markers (KDR, Brachyury T, and THY-1), Sox trio chondrogenic markers (SOX9, SOX6, and SOX5), joint interzone-specific markers (WNT9A and SOSTDC1) and collagens and ECM markers (COL1A1, COL2A1, COL10A1, and ACAN). Data are expressed as means ± sd for gene expression vs. hiPSCs (logarithmic scale) and represent 3 independent experiments.

