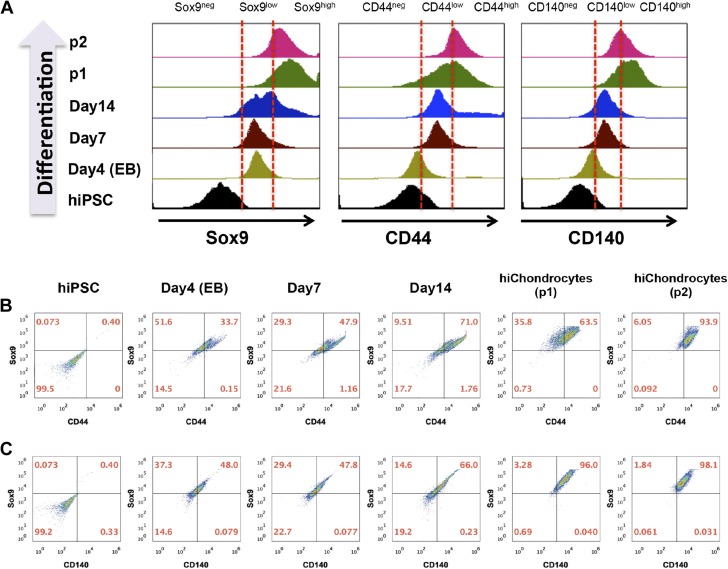
Figure 3.
Single-cell flow cytometric analyses during chondrogenic differentiation of hiPSCs. A) Representative analyses of Sox9-, CD44-, and CD140-expressing cells during chondrogenic differentiation of hiPSC. Representative flow cytometric analyses of (B) CD44 and (C) CD140 coexpression in Sox9-expressing cells at d 0, 4, 7, 14 after induction of hiPSC differentiation and in hiChondrocytes (passages 1, 2).

