
Figure 2.
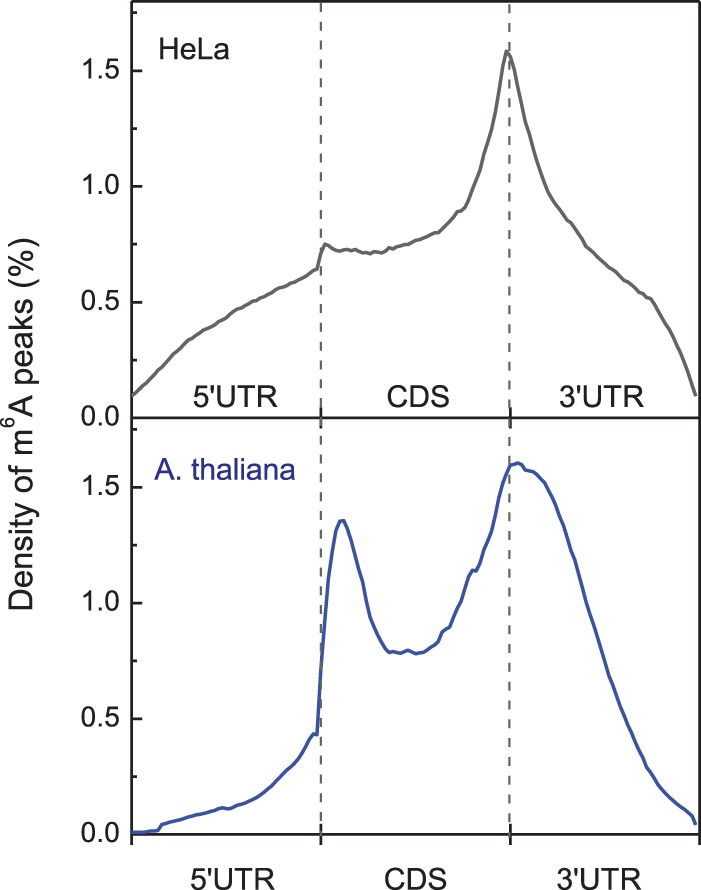
The normalized distribution (density) of m6A peaks along the mRNA transcripts in HeLa cells (top panel) and Arabidopsis thaliana (bottom panel), where each mRNA transcript is divided into the 5′ UTR, coding sequences (CDS), and the 3′ UTR.
Official websites use .gov
A
.gov website belongs to an official
government organization in the United States.
Secure .gov websites use HTTPS
A lock (
) or https:// means you've safely
connected to the .gov website. Share sensitive
information only on official, secure websites.
The normalized distribution (density) of m6A peaks along the mRNA transcripts in HeLa cells (top panel) and Arabidopsis thaliana (bottom panel), where each mRNA transcript is divided into the 5′ UTR, coding sequences (CDS), and the 3′ UTR.