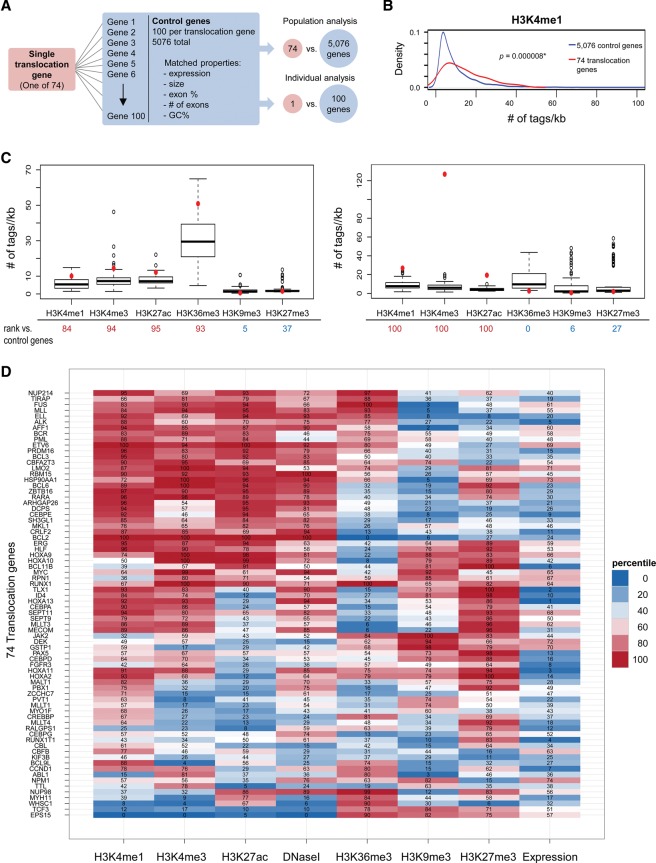
Figure 1.
Computational analysis of chromatin features at recurrent translocation genes. (A) Strategy for analysis of chromatin features using a population or individual gene approach. Seventy-four frequent translocation genes were identified, and, for each translocation gene, 100 control genes were selected with closely matched properties: expression, size, exon percentage, number of exons, and GC percentage. (B) For population analysis, a kernel density plot comparing H3K4me1 signal density distribution in 74 translocation genes versus 5076 control genes is shown. Signal density was measured over each annotated gene body ±2 kb, and the average read count (number of tags per kilobase per 1 million reads) in each gene is represented on the X-axis. The distribution of H3K4me1 in translocation genes is significantly enriched compared with control genes. (*) P < 0.01, Wilcoxon test. (C) For individual gene analysis, the average read count (number of tags per kilobase per 1 million reads) for each histone modification of each translocation gene (red dot) was compared with its 100 control genes (box plot). The percentage of control genes whose tag densities were lower than that of the translocation gene was calculated (rank listed below the X-axis). (D) Heat map of individual analyses of histone modifications and DNase I hypersensitivity for 74 translocation genes. The percentiles of each translocation gene ranked amongst its control genes are indicated. The rank of expression for translocation genes from 1 to 74 is shown at the right. Translocation genes were hierarchically clustered using the overall ranking matrix.

