Figure 4.
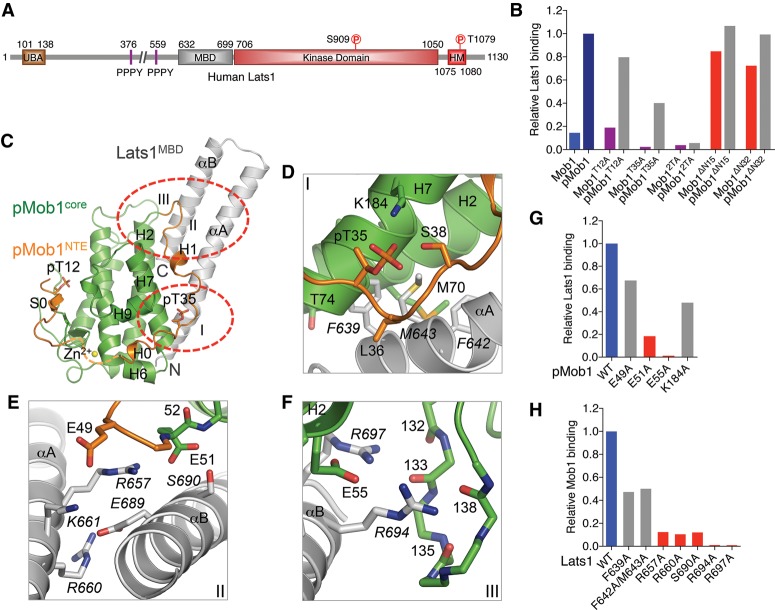
Crystal structure and binding interface of human pMob1–Lats1. (A) Domains and motifs of human Lats1 with their boundaries indicated. (B) Quantification of Lats1 binding of the indicated Mob1 and pMob1 proteins. The relative Lats1 intensities were normalized to that of wild-type GST-pMob1 (100%). (C) Overall structure of pMob1–Lats1. Three pMob1–Lats1 interfaces (I–III) are circled. The Mob1 N-terminal extension (NTE) is colored orange. The Mob1 core is colored green. Lats1 is colored gray. pT12 and pT35 are shown as sticks. (D–F) Zoomed-in views of pMob1–Lats1 interactions at interfaces I–III. Residues from Lats1 are labeled in italic. Residues from the Mob1 core (green), Mob1 NTE (orange), and Lats1 (gray) are shown as sticks. (G) Quantification of Lats1 binding of the indicated pMob1 proteins. The relative Lats1-binding intensities were normalized to that of wild-type GST-pMob1 (100%). (H) Quantification of GST-pMob1 binding of the indicated Lats1 proteins. The relative amounts of Lats1 bound to GST-pMob1 were normalized to that of wild-type Lats1 (100%).

