
Figure 5.
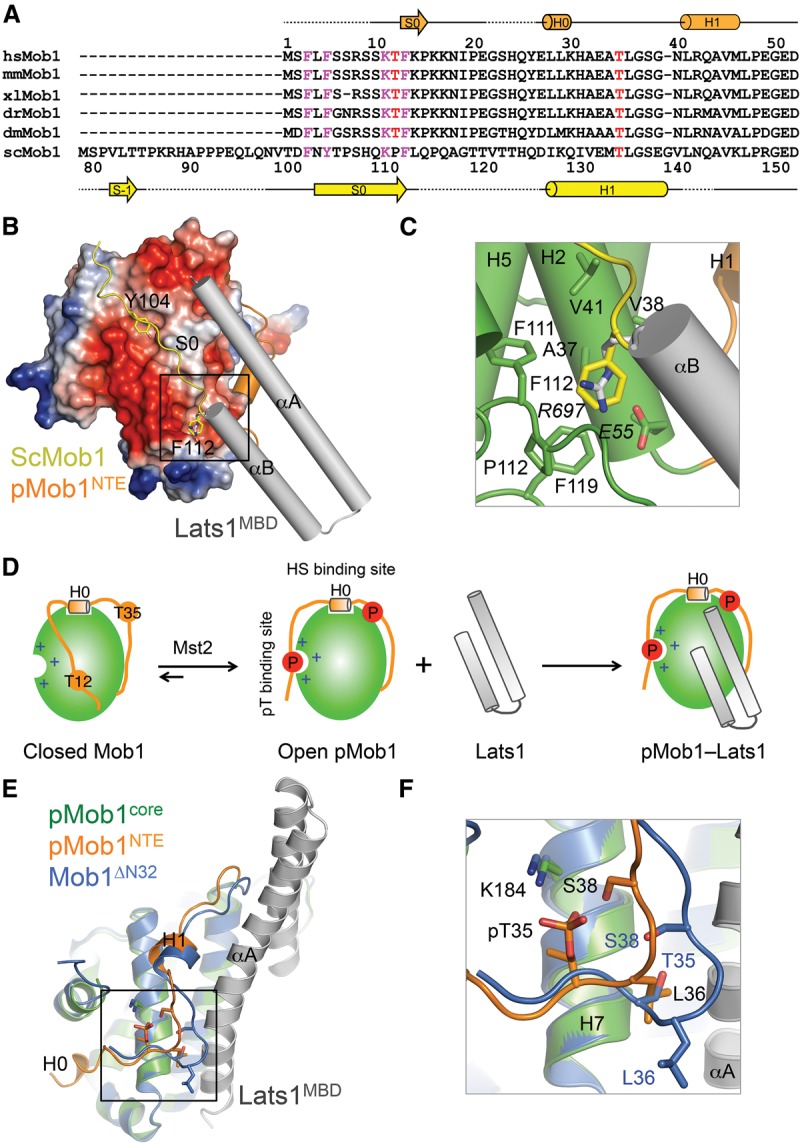
Phosphorylation-dependent conformational activation of Mob1. (A) Sequence alignment of the N-terminal region of Mob1. Secondary structural elements of pMob1 are drawn above the sequences. Secondary structural elements of S. cerevisiae (Sc) Mob1 are drawn below the sequences. The conserved FxFx5KxF motif is colored magenta. T12 and T35 are colored red. (B) Superposition of ScMob1 (Protein Data Bank [PDB] code 2HJN) and pMob1–Lats1 structures (this study). Only the FxYx5KxF motif-containing fragment from ScMob1 is shown. The Mob1-binding site of ScMob1 F112 is boxed. (C) Zoomed-in view of the boxed region in B to show that ScMob1 F112 (yellow sticks) and Lats1 R697 (gray sticks) occupy the same Mob1-binding site. (D) Model of phosphorylation-triggered conformational activation and Lats1 binding of Mob1. (E) Superposition of unphosphorylated Mob1ΔN32 (PDB code 1PI1) and pMob1–Lats1 structures (this study). Mob1ΔN32 is colored blue. The pMob1 core is colored green, and pMob1 NTE is colored orange. Lats1 is colored gray. The H0–H1 loop around pT35 is boxed. (F) Zoomed-in view of the boxed region in E to show the reorganization of the H0–H1 loop in pMob1 by T35 phosphorylation. Residues of Mob1ΔN32 and pMob1 are shown as blue and orange sticks, respectively.