Figure 6.
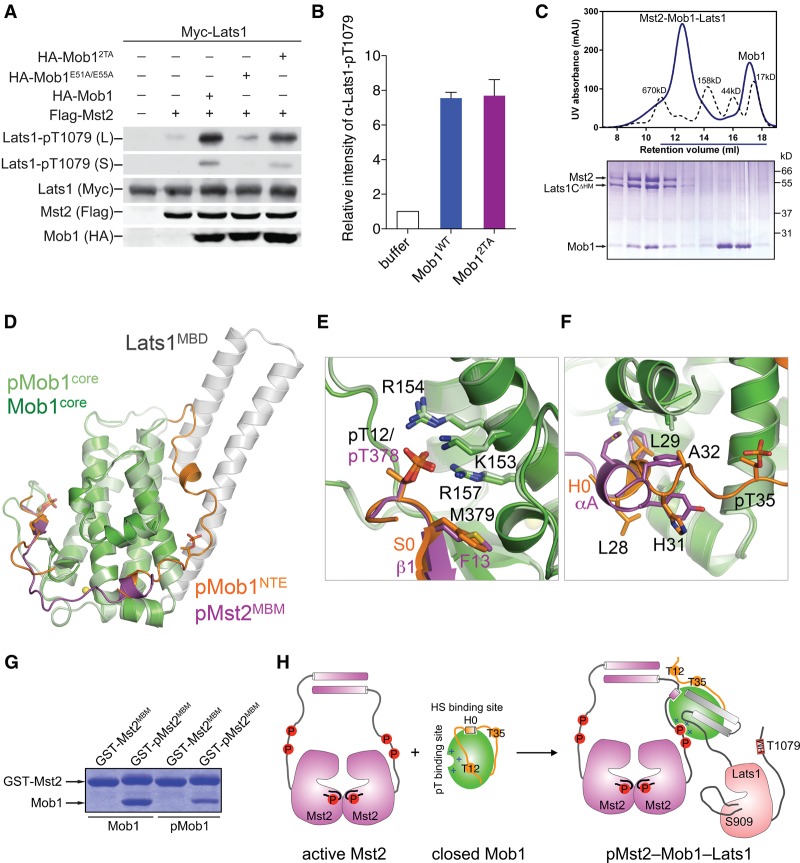
Mst2 binding to Mob1 is sufficient to activate Mob1 for Lats1 binding. (A) Immunoblots of lysates of HEK293 cells transfected with the indicated plasmids. Both long (L) and short (S) exposures of the Lats1-pT1079 blots are shown. (B) Quantification of Lats1C (residues 602–1130) T1079 phosphorylation by Mst2 in the presence of Mob1 wild type or 2TA. Means with range for two independent experiments are plotted. (C) UV traces of molecular weight standards (dashed line) and the Mst2–Mob1–Lats1CΔHM complex (solid line) fractionated on a Superose 6 gel filtration column. The underlined fractions were separated on SDS-PAGE and stained with Coomassie. (D) Superposition of pMst2–Mob1 and pMob1–Lats1 structures. (E,F) Zoomed-in view of the pT- and HS-binding sites of the superimposed structures in D. Residues of the Mob1 core (green), pMob1 (pale green), the Mob1 NTE (orange), and pMst2 (magenta) are shown as sticks. S0 and H0 of pMob1 NTE are colored orange. αA and β1 of pMst2 are colored magenta. (G) Coomassie-stained gel of Mob1 or pMob1 bound to GST-Mst2MBM (residues 371–401) or GST-pMst2MBM beads. (H) Model for pMst2-dependent activation of Mob1 for the formation of the pMst2–Mob1–Lats1 ternary complex.

