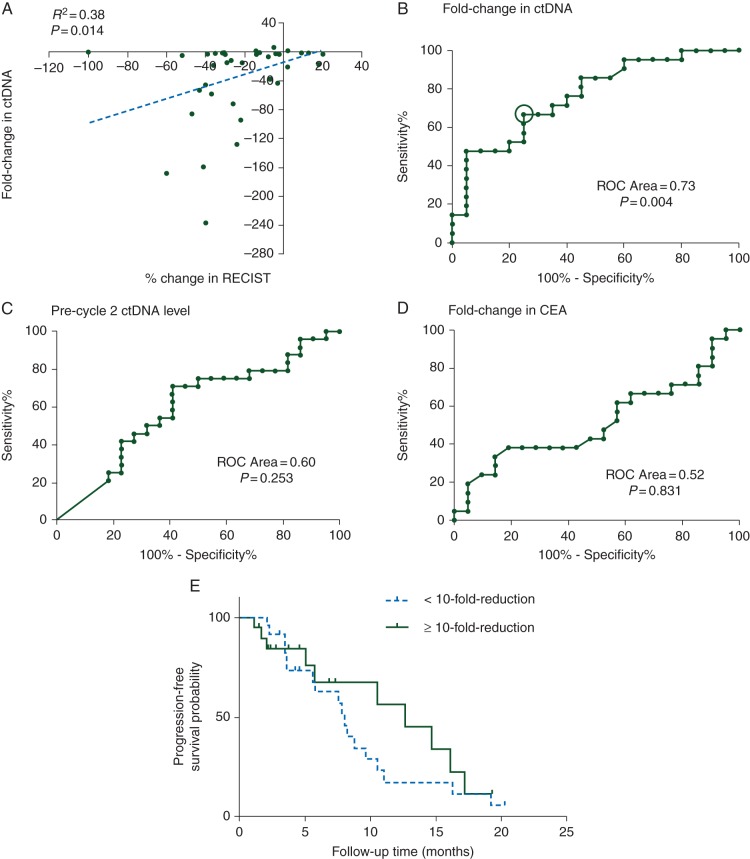
Figure 3.
(A) Correlation plot of percentage change in RECIST and fold change in ctDNA; (B–D) Receiver operating characteristic (ROC) analysis of fold change in ctDNA, ctDNA level after one cycle of chemotherapy and fold change in CEA, to predict tumor response; the circle in (B) indicates the location on the curve corresponding to a 10-fold change threshold (sensitivity 0.75, specificity 0.64); (E) Kaplan–Meier estimate for PFS in metastatic colorectal cancer patients with <10- and ≥10-fold reduction in ctDNA after one cycle of chemotherapy.

