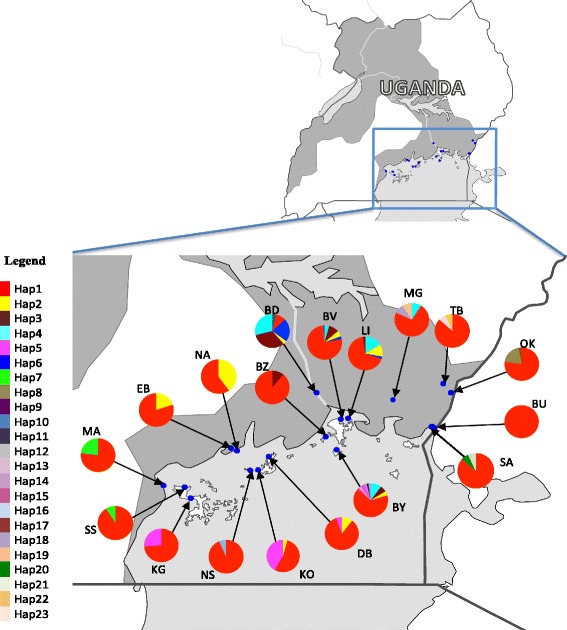
Fig. 1.

Map showing the location of the 18 sampling sites and the distribution of the 23 COII mtDNA haplotypes of G. f. fuscipes recovered from the analysis of 485 individuals in the Lake Victoria Basin, Uganda. Blue dots represent sampled localities, pie charts indicate frequencies of the haplotypes in the sampled localities and each colour in a pie chart represents a haplotype. The inset in the upper right corner shows the location of sampling sites with reference to the whole of Uganda and neighboring countries
