
Figure 2. Concordance between fresh-frozen and FFPE samples.
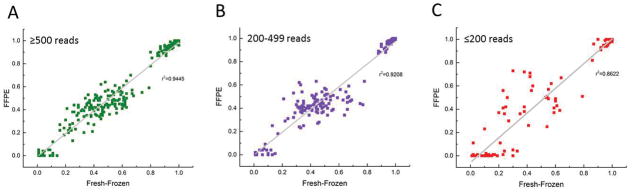
Each dot represents an SNV in a matched pair of fresh-frozen and FFPE tumor samples detected at above 500 reads (high correlation) (A) between 200 and 499 reads (medium to high correlation) (B) and below 200 reads (low correlation) (C).