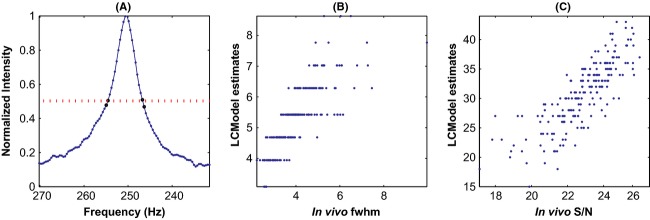
Figure 4.

Estimation of fwhm and scatter plots of estimates: (A) shows acetyl moiety peak of a typical in vivo spectrum and highlights pair of data points on either side of each half-maximum; the frequencies corresponding to each pair is extrapolated to estimate fwhm. The scatter plot of our estimates of fwhm against LCModel estimates in (B) show that while LCModel estimates are discrete, our estimates are continuous. Tight scatter of S/N estimates shown in (C) validates both the estimation approaches.
