
Figure 5.
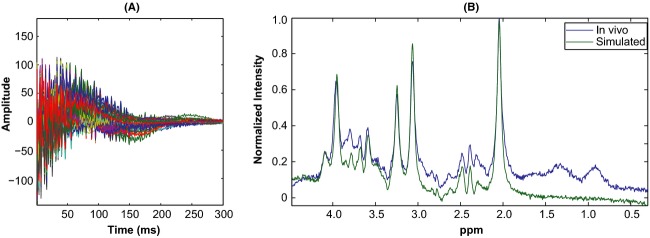
Realistic simulations: Real parts of 206 simulated time series signals shown compare well with corresponding in vivo signals shown in Fig.3A. Also shown is a typical in vivo spectrum and its corresponding simulated spectrum constructed using estimates from that spectrum and LCModel basis set. Notice how well the simulated spectrum resembles in vivo, despite visible differences due to noninclusion of lipids, lactates, and macromolecule resonances in the model.