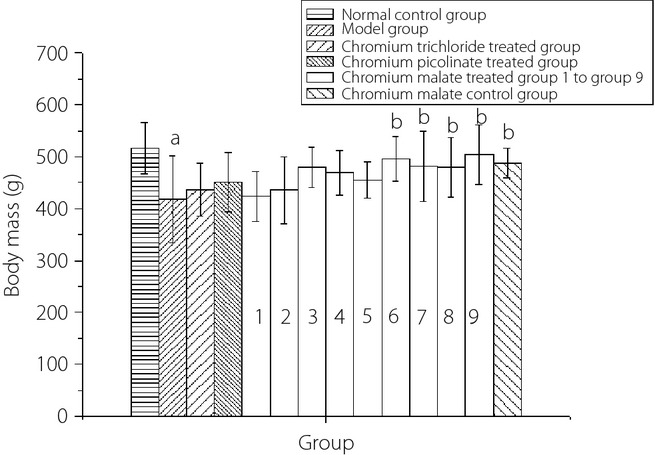
Figure 5.

The dose–response relationship of chromium malate in the body mass of normal and type 2 diabetic rats in the fourth week. Chromium trichloride and chromium picolinate were used as positive controls. Each value was presented as mean ± SD (n = 10). aSignificantly different from normal control group (P < 0.05). bSignificantly different from model group (P < 0.05). cSignificantly different from chromium trichloride-treated group (P < 0.05). dSignificantly different from chromium picolinate-treated group (P < 0.05).
