. 2015 Jul 2;6(4):407–412. doi: 10.1111/1759-7714.12188
© 2014 The Authors. Thoracic Cancer published by Tianjin Lung Cancer Institute and Wiley Publishing Asia Pty Ltd.
This is an open access article under the terms of the Creative Commons Attribution-NonCommercial License, which permits use, distribution and reproduction in any medium, provided the original work is properly cited and is not used for commercial purposes.
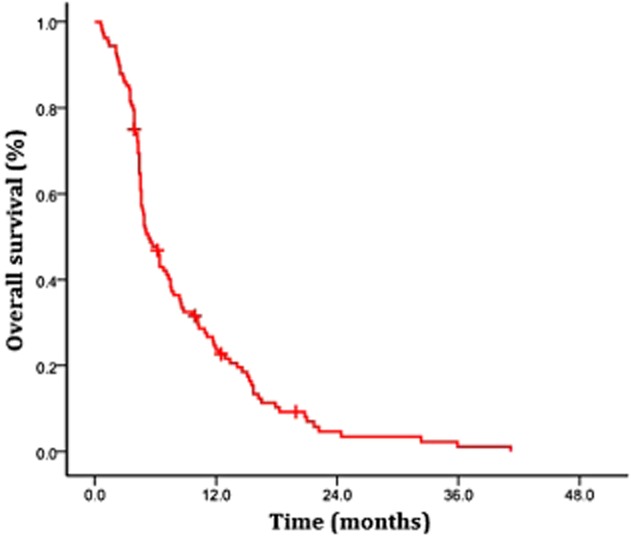
Figure 1.

Overall survival for entire cohort.  , overall population (n = 108).
