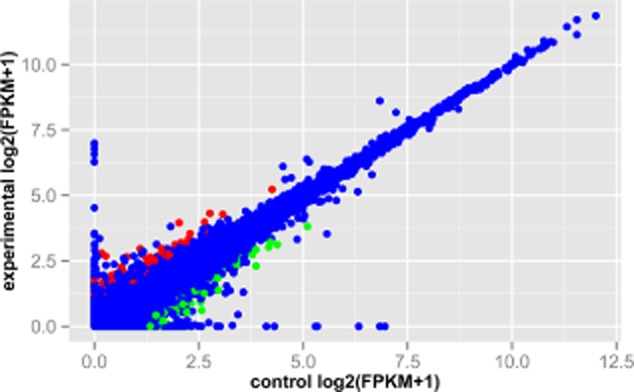
Figure 2.

The scatterplot of gene expression levels in human squamous cell lung carcinoma SK-MES-1 cells with and without curcumin treatment. The red represents upregulated genes in SK-MES-1 cells with curcumin treatment compared with the cells without curcumin treatment; green represents downregulated genes in the treatment groups; blue represents the genes that were not significantly differentially expressed. The X-axis represents the control groups and the Y-axis represents the treatment groups.
