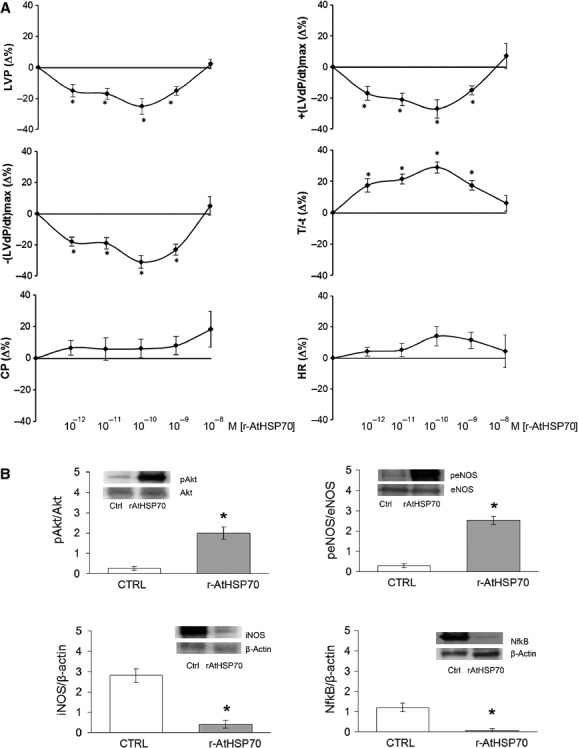
Figure 2.

(A) Dose–response curves of r-AtHSP70 (10−12–10−8 M) on LVP, +(LVdP/dT)max, −(LVdP/dT)max, T/−T, CP and HR, on Langendorff perfused rat heart preparations. Percentage changes were evaluated as means ± SEM of seven experiments. Significance of difference from control values was evaluated by one-way anova; *P < 0.05. (B) Immunoblots showing Akt and eNOS phosphorylation, and iNOS and NFκB expression in cardiac ventricles (n = 4). Significance of difference from control values was evaluated by one-way anova; *P < 0.05.
