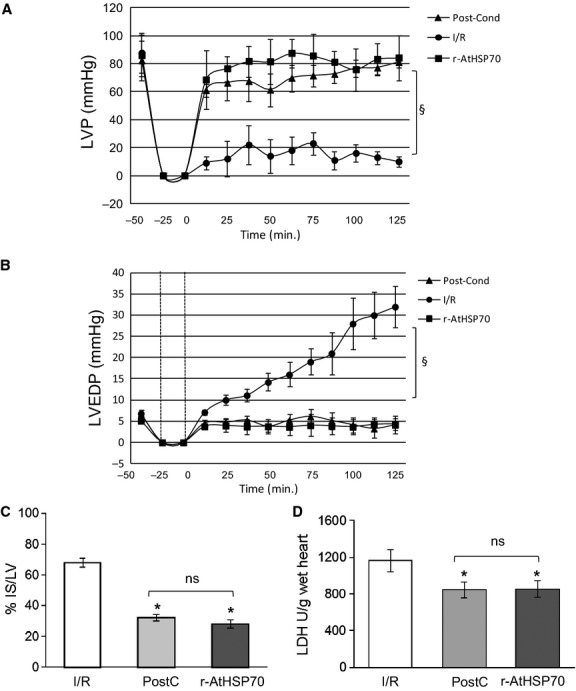
Figure 3.

LVP (A) and LVEDP (B) variations. Data are expressed as changes of LVP and LVEDP values (mmHg) from the stabilization to the end of the 120 min. of reperfusion with respect to the baseline values for each group. Vertical lines indicate ischemic administration. Comparison between groups, §P < 0.05. (C) Infarct size. The amount of necrotic tissue measured after 30-min. global ischemia and 120-min. reperfusion is expressed as percentage of left ventricle (IS/LV %). (D) LDH release in I/R, PostC and r-AtHSP70 PostC. Significance of difference was evaluated by one-way anova; *P < 0.05 with respect to I/R. N = 6 for each group.
