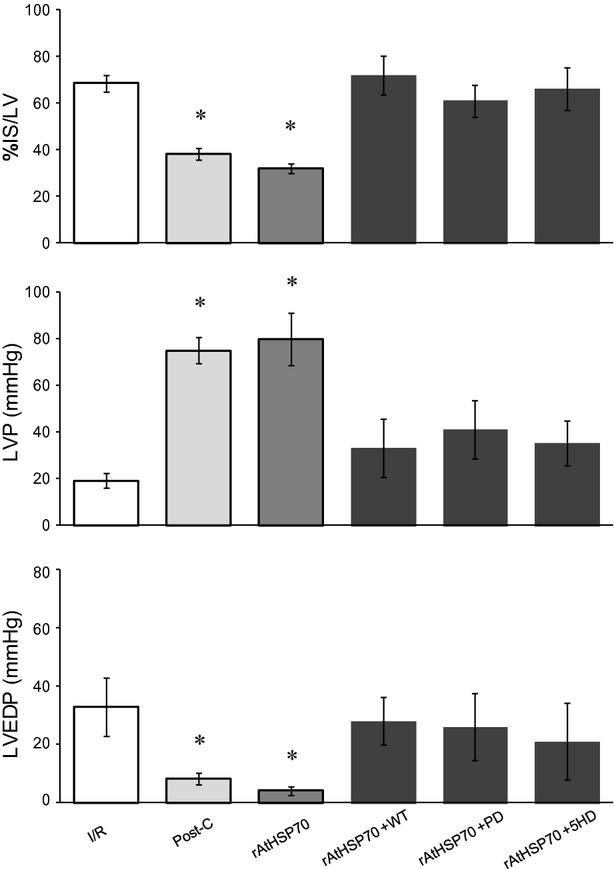
Figure 4.

Percent variation in Infarct Size(IS)/LV and absolute values of systolic and diastolic function (LVP and EDP) at the end of 120-min. reperfusion of following groups: I/R, PostC, r-AtHSP70 alone and r-AtHSP70 plus inhibitors (WT, PD and 5HD). Significance of difference was evaluated by one-way anova; *P < 0.05 with respect to I/R. N = 6 for each group.
