
Figure 6.
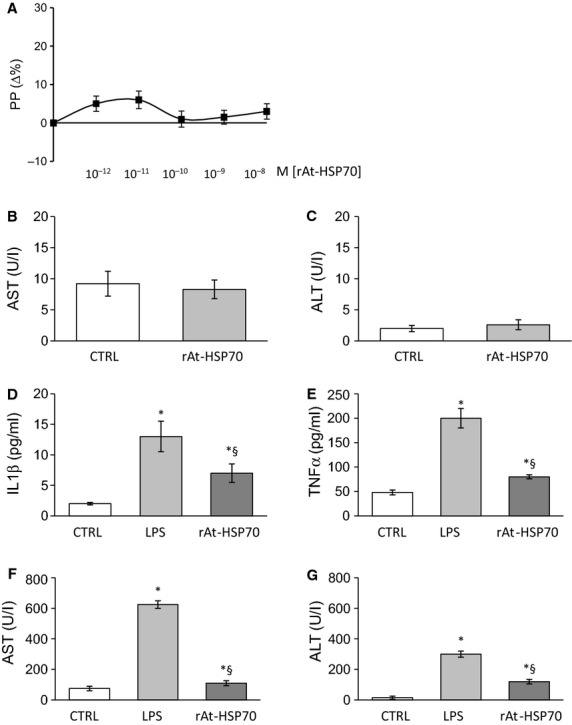
(A) Dose–response curves of r-AtHSP70 (10−12–10−8 M) on portal pressure (PP) of the isolated and perfused rat liver. ELISA analysis of AST (B) and ALT (C) in liver collected perfusate. Biochemical analysis of plasma levels regarding IL-1β (D), TNF-α (E), AST (F) and ALT (G) after chronic treatment with placebo, LPS and LPS plus HSP70. *P < 0.05 (LPS or LPS plus HSP70 versus control); §P < 0.05 (LPS plus HSP70 versus LPS alone), N = 6.