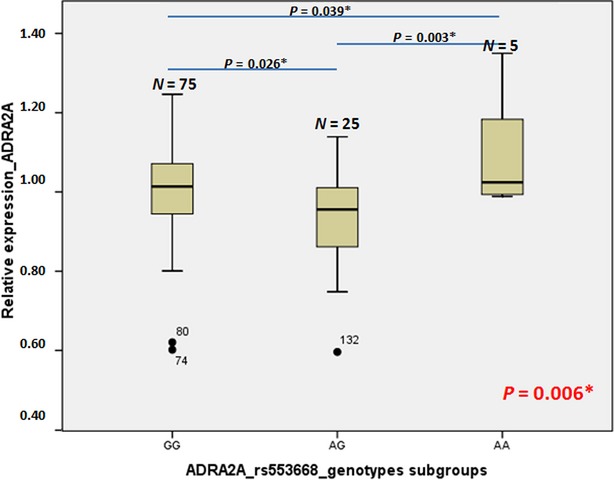
Figure 3.

Box plots depicting relative α2A-AR gene expression according to genotype in bone; expression for the reference genotype (associated with low α2A-AR gene expression) is set to 1. Numbers above the boxes indicate the number of individuals with that genotype. The bottom and top of each box indicate the 25th and 75th percentiles, respectively, while the line inside the box is the mean value. Whiskers represent the smallest and the values that are not outliers. Circles with the code of the sample indicate outliers. The P-value in red represents the anova statistical result for differences in α2A-AR gene expression according to α2A-AR genotypes subgroups, while P-values in black represent the LSD post hoc testing between each of two genotype subgroups. P-values with asterisks are statistically significant (below 0.05).
