Figure 2.

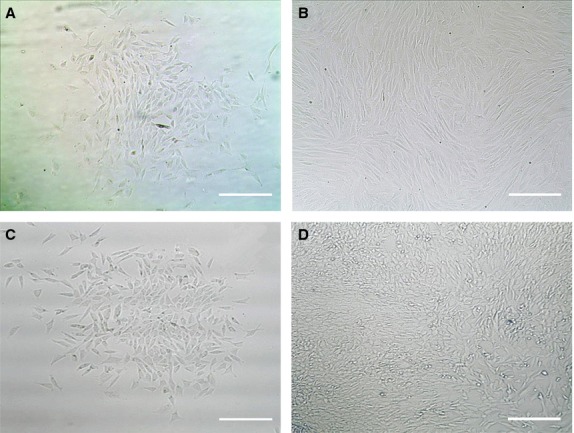
Phase contrast images of primary and the third passage bone marrow stem cells (BMSCs; A and B) and primary and the first passage AFSCs (C and D). Scale bars, 20 μm.

Phase contrast images of primary and the third passage bone marrow stem cells (BMSCs; A and B) and primary and the first passage AFSCs (C and D). Scale bars, 20 μm.