
Figure 2.
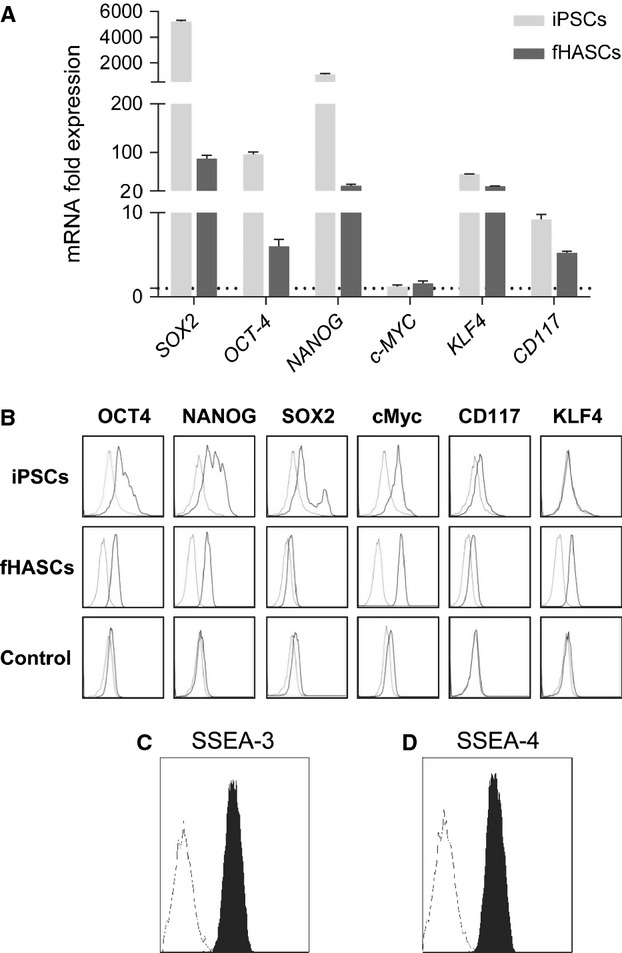
Stem cell-like phenotype of fHASCs. (A) Analysis of expression of pluripotent markers by real-time PCR in fHASCs. Data (mean ± SD of three experiments. This is explained a few lines below, prior to (B)) are presented as normalized transcript expression in the samples relative to normalized transcript expression in control cultures (that is, a pool of eight aliquots of amniotic fluid cells, in which fold change = 1; dotted line). iPSCs, derived as described in Material and methods, were used as a positive control. *P < 0.05; **P < 0.001 (Shapiro test). (B) Analysis of pluripotent marker expression by FACS in fHASCs. (C and D) Analysis of the embryonic stem cell markers SSEA-3 and SSEA-4 by flow cytometry in fHASCs. Data are representative of three independent experiments conducted on five fHASC lines.