
Figure 1.
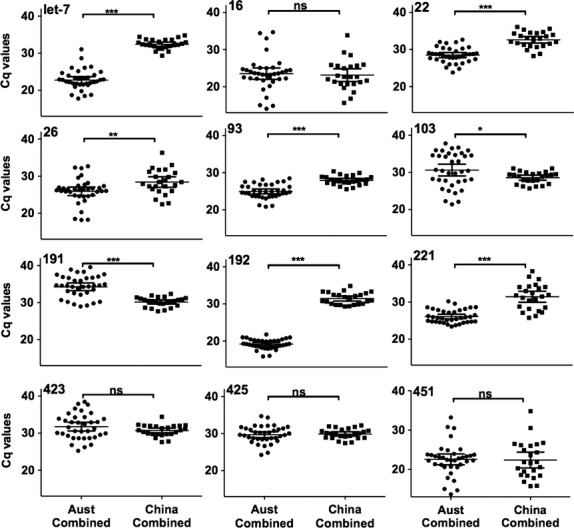
Expression levels of candidate reference miRNAs by cohort. Expression levels of the 12 candidate reference miRNAs in the combined Australian cohort (n = 36) and the PRC cohort (n = 24) were determined by qPCR. Values are given as the quantification cycle (Cq mean of duplicate sample). Significant differences were calculated by Wilcoxin rank-sum test. *0.01 to <0.05, **0.001 to <0.01, ***<0.001, ns = not significant.